


Captain Powell Tries To 'Communicate'
November 5, 2022
Well, that was one for the record books. As Zero Hedge so colorfully described it, the last 90 minutes on the stock market yesterday brought the worst plunge on a Fed day in recorded history!
After Powell’s exquisite rugpull, where the most dovish Fed statement in almost one year was followed by the most brutally hawkish press conference where the Fed chair basically told markets to eat shit and die when he said that interest rates could go higher than previously projected, leading to the worst final 90 minutes of trading on a Fed day in history.

In this case, the stock market’s end of the day hissy fit was especially telling. To wit, traders had just seized upon new language in the Fed statement that referenced the lagged impact of monetary tightening. Apparently, this was interpreted as code for “pause” and in a nanosecond the stock indices were ripping higher:
…..the committee will “take into account the cumulative tightening of monetary policy, the lags with which monetary policy affects economic activity and inflation, and economic and financial developments.”
Alas, Jay Powell was standing at the ready with a supersized bucket of cold water. No sooner were stock prices high in the green clover than these words came tumbling across the tube:
“It is very premature to be thinking about pausing. People when they hear ‘lags’ think about a pause. It is very premature, in my view, to think about or be talking about pausing our rate hikes. We have a ways to go,” he said.
Well, these broken markets put you in mind of Paul Newman, who was also sent tumbling into the dirt by The Captain (warden) in that famous scene in Cool Hand Luke. As the latter thus explained his action:
“What we’ve got here is failure to communicate. Some men you just can’t reach. So you get what we had here last week, which is the way he wants it. . . “
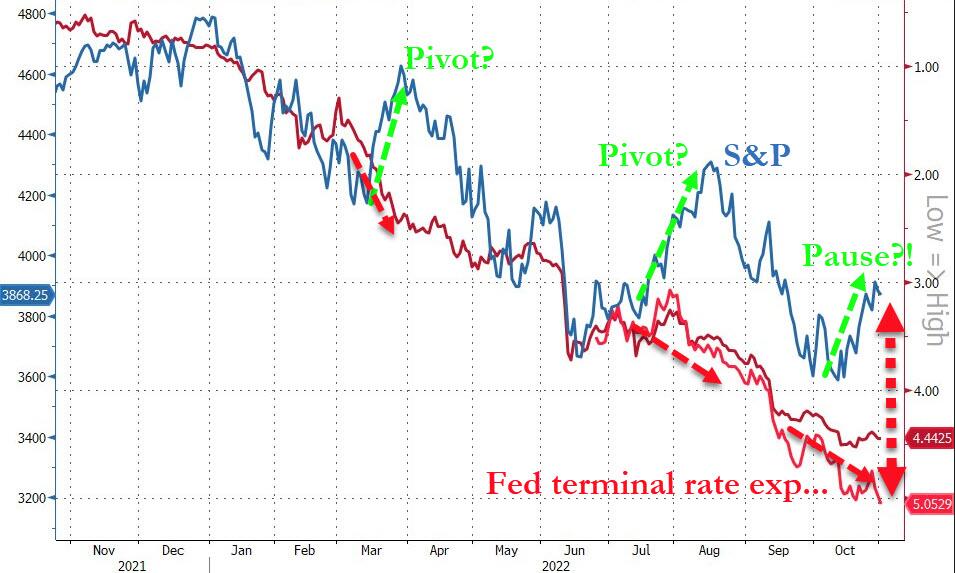
That is surely the case with today’s liquidity-addicted markets, which apparently insist on being punished again and again. After all, prior to yesterday there had already been three aborted breakouts this year on the basis of increasingly diluted versions of the “pivot”.
Thus, last March stocks (blue line) ripped higher on Pivot hopes that rate cutting would start by year-end, even though the expected “terminal” Fed funds rate at that point was just 2.00%.
That is to say, CPI inflation was already 7.9% Y/Y, but the robo-machines and day-traders were persuaded that the Fed would soon re-open the liquidity spigot 600 basis points lower. Talk about delusional spoiled brats.
Of course, then came the big summer Pivot rally, when the expected terminal rate was still just 3.5% and the CPI had already hit 9.0% (June Y/Y). Again, the markets were either immensely dense or unaccountably expecting an overnight collapse of inflation back toward the Fed’s 2.00% target.
Next came the mid-October “pause” rally on the heels of an 8.2% CPI report for September. At that point, the expected terminal” rate had risen to 4.4%, but it was still a case of same song, different verse.
Inflation had by now proved to be stubbornly embedded, but the infinitely coddled gamblers of Wall Street insisted yet again that a deeply negative real Fed funds rate would somehow be sufficient to bring inflation to heel.
Needless to say, Powell is no Volcker, as we will remind once again below. But we are beginning to think that he might at least resemble The Captain. He is trying to communicate with these people, but apparently they just don’t want to be reached.
Still, you’d think today’s report that unit labor costs continued to soar during Q3 might bring at least a semblance of sobriety down in the canyons of Wall Street. The Y/Y gain of 6.1%was down a tad from Q2’s shocker (+7.9%), but the implications are no less ominous: Namely, when you are dealing with this kind of liquidity-driven cost-push inflation, there is no way the CPI or the PCE deflator are coming back to earth any time soon with labor costs rising north of 6% per annum.
In fact, the unit labor cost gains of the last two quarters are the highest since mid-1982, and you don’t need to be a professional student of economic history to ascertain what that means. To wit, Volcker finally broke the back of cost-push inflation by driving real interest rates to levels that are scarcely imaginable today, and which make a mockery of the repetitive “pivot” breakouts shown above.
Y/Y Change In Nonfarm Unit Labor Costs, 1982 to 2022

For want of doubt, here is the unit labor cost up-welling that Volcker confronted and eventually reversed back in the late 1970s and early eighties. As it happened, unit labor costs had begun to accelerate after the 1975 recession by Q4 1976, rising by 5.2% on a Y/Y basis.
By the time that Volcker arrive at the Fed in Q3 1979, unit labor cost increases had soared by roughly 550 basis points. That brought the Y/Y gain to 10.6%, representing an increase from Q4 1976 roughly equal to what has transpired this time around since Q3 2019.
But as the chart shows, notwithstanding Volcker’s severe application of the monetary brakes unit labor costs kept rising to a peak of 11.6% Y/Y in Q2 1980, and even thereafter gave ground grudgingly.
In fact, it was not until early 1983 – after two recessions – that unit labor cost growth returned to its late 1976 level. That is to say, cost push inflation proved to be “sticky” indeed.
Y/Y Change In Unit Labor Costs, 1976 to 1982

Needless to say, Tall Paul Volcker did not break the back of cost-push inflation by coddling either Wall Street or commodity speculators. To the contrary, he drove real interest rates sky high, and only then did the credit-fueled bubble of the 1970s succumb to financial stringency sufficient to reverse the inflationary momentum.
Thus, when Volcker took the helm in August 1979, the inflation-adjusted Fed funds rate (purple line) was slightly negative, while the CPI (black line) was posting at a 11.5% Y/Y rate of increase. So the Volcker Fed kept pushing nominal rates higher – at increments which far outpaced the current Fed increases – until the real rate peaked at 9.4% in June 1981.
In needs be noted, however, that this sustained 23-month long push higher occurred well beyond the time that the CPI peaked at 14.6% Y/Y in March 1980. In fact, when Volcker finally slightly loosened the real rate 15-months later, the Y/Y CPI was already down by 500 basis points to 9.6%.
That is to say, a one-third rollback of the inflationary tide had been deemed insufficient to justify a policy “pivot”, thereby representing a level of monetary discipline that is virtually unthinkable today whether Powell is truly a born-again inflation-fighter or not.
Likewise, the yawning positive gap between the real rate and actual inflation readings on the left panel of the chart (1979 to 1981) soon flipped-over into a negative gap after September 1982, when the real funds rate posted at 5.4% versus the CPI reading of 4.9%.
And that gap was maintained well into the mid-1980s, meaning that the Volcker Fed was not about to allow cost-push inflation to gain a new lease on life. Indeed, by April 1986 the real funds rate was still 5.4%, even as the CPI gain had deflated to just 1.6% on a Y/Y basis.
The spring of 1986, however, proved to be the high water mark of Volcker’s campaign to restore sound money. Shortly before then had come the US Treasury concocted Plaza Accord to trash the dollar, while shortly thereafter Volcker got the axe from Treasury Secretary James Baker, a Texan in the school of John Connally who never saw an interest rate he didn’t think should be lower.
Real Fed Funds Rate Versus Y/Y Change In CPI, 1979 to 1986

This gets us to the $9 trillion question. Does the newly hawkish Jay Powell have even a fraction of the gumption and staying power that Paul Volcker demonstrated 40 years ago?
During his presser yesterday, he made you think he understands that today’s virulent inflation will not be crushed by a mini-recession like the first Volcker Recession in 1980; and that he must therefore stay the course – -even at the expense of far higher “terminal” rates than now expected by the market – until the Fed funds rate has been returned to meaningfully positive territory in inflation-adjusted terms.
“At some point, as I’ve said in the last two press conferences, it will become appropriate to slow the pace of increases as we approach the level of interest rates that will be sufficiently restrictive to bring inflation down to our 2 percent goal. There is significant uncertainty around that level of interest rates. Incoming data since our last meeting suggests that the ultimate level of interest rates will be higher than previously expected.”
But here’s the thing. Anyone who presided over the absolute insanity of his first five years in the top chair at the Eccles Building probably cannot be trusted to see it through. After all, when Powell was sworn in as Fed Chairman in January 2018, the Fed’s balance sheet stood at $4.439 trillion, the work of 15 chairmen over 104 years.
When he finally blinked in March 2022 and began to reluctantly raise rates from the zero-bound where they had been hideously impaled, the balance sheet stood at $8.937 trillion.
So the math of it speaks a thousand words. The gain during Powell’s first 50-months was $4.298 trillion, a figure larger than the money-printing total of all of his predecessors combined!
Fed Balance Sheet, January 2018 to March 2022

Having so clarified the picture, we give the estimable Gary Kaltbaum the last word on the matter:
It is stunning…just stunning, how the many are so dependent on the one man who printed massive amounts, unimaginable amounts of money, which caused unprecedented instability in everything…will be the cure to all that instability. It is staggering that the many are dependent on one man and his whims to control a $40 trillion market and a $20 trillion economy.
Just staggering. He really did create a dependency, not only financially but psychologically. You were warned. We have warned since Christmas 2018 and even more as he and his merry band of easy money misfits printed to a gargantuan $9 trillion. And to make matters worse, he got the ECB to do the same and to this day, they are much worse. You were warned.
PEAK TRUMP, IMPENDING CRISES, ESSENTIAL INFO & ACTION
Reprinted with permission from David Stockman’s Contra Corner.
 War Breeds Empire, Death, Starvation, Genocide, and Hatred, and The U.S. Is the Most Heinous Perpetrator of War in the History of the World