


Pandemic Data
May 6, 2020
The Center for Disease Control publishes data regularly for Covid-19 the novel coronavirus pandemic sweeping the world. CNN has a totally morbid and incorrect ‘scoreboard’ of cases and deaths. I look at it everyday in the hope that it will eventually stopped being displayed. It is meaningless and scary, especially scary for the statistically disinclined. This is updated regularly. The table we will discuss is for ‘Deaths involving coronavirus disease 2019 (COVID-19), pneumonia reported to National Center for Health Sciences (NCHS) by jurisdiction of occurrence, United States. Week ending 2/1/2020 to 4/25/2020. I highly recommend every American look at this data as it is not very difficult to understand. Here is a summary of data from the CDC website. You can download this as an Excel spreadsheet for ease of manipulation right here. These are government statistics so take them with a grain of salt they are really order of magnitude datums as the columns do not exactly total up, but you get the idea.
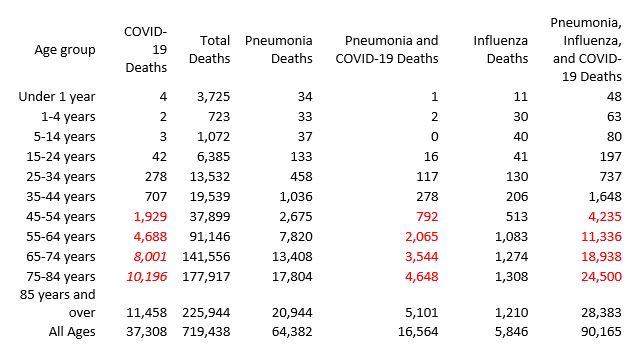
Looking at the numbers in red it is clearly obvious that this is an old age disease. The young out of a population over a hundred million are not dying in great numbers. There is an axiom in healthcare that if you make it through your fifties in good health it is highly probable that you will see old age. The simple reason for this is accumulated bad habits as adults and even multiples of them start to wear you down after thirty years; think of smoking, alcoholism, morbid obesity and drug abuse as good starters. The young and healthy are not dropping dead in droves in spite of the fearmongers. Bureaucrats will want to take the credit for the social distancing orders of questionable legality have handed down, but whether or not that is true will only be known retrospectively.
 The Phoenix Program
Best Price: $14.55
Buy New $11.00
(as of 04:30 UTC - Details)
The Phoenix Program
Best Price: $14.55
Buy New $11.00
(as of 04:30 UTC - Details)

Everyday at noon EDT CNN runs the governor of New York Andrew Cuomo talking off the top of his head for an hour; a guy that actually does not have much new to say, he’s like a broken record. Between slams on the Trump administration (half of what CNN produces) and demands for the rest of the country to do something for New York more healthcare workers, more drugs, more masks, more ventilators, more, more. The very last place I would go for any reason right now is the states of New York, New Jersey, Pennsylvania and Massachusetts the epi-center of this disaster! Motown would not bother me. New York City has been a plague on the public fisc as their inability to be fiscally responsible has caused the city to go bankrupt many times turning to the Federal Government (a clever euphemism for me and you). When the housing bubble exploded I did not hear any stories of finance big shots bailing the poor out even though they gave themselves huge bonuses courtesy of Lil’ Bush bail out largesse that kept them off the dole.
The table below will show you deaths by state. It should be clear that the majority of Covid-19 deaths are in New York (City being the worst), New Jersey, Pennsylvania, Michigan and Massachusetts. These all places where the population density is much much higher than the rest of the nation. Tennessee like Michigan has approximately 4 million residents yet Tennessee has only a 191 deaths compared to Michigan’s 1,851. Having grown up in Michigan I attest this to the fact that Detroit once one of the wealthiest cities in the country has fallen on abject times. No other city in the history of this country has seen such a decline. I witnessed this first-hand as the perfect storm of corrupt politicians and corrupt unions drove the automotive business elsewhere, but that is a story for another article. It is the abject poverty, lack of education and healthcare that is killing in Detroit and even that will have stopped by August.
In a previous article I wrote about Ultraviolet Salvation how UV solar radiation from the Sun destroys the virus and naturally limits its spread. As of today Malaysia a densely populated poor country in comparison to the west has 105 deaths. Indonesia another densely populated state has 865. The death total in the Philippines is 623. Vietnam has zero deaths. Where the sunshine’s strong the deaths are low. Even where population densities are sky high by western standards UV destroys the viruses. I am not a bio-statistician or even a regular statistician but anyone with a seventh grade education can read these charts and draw their own conclusions. Some would say that the virus numbers are not accurate to which I would say if 60,000 dead covid-19 victims were stacked up in one of these countries someone would be talking about it.
The first statistic is that during this period 719,438 Americans died from all causes. So in a population of more than 328,000,000 roughly 0.02 percent of Americans died. Our population is increasing because the birth rate is greater than the death rate. During this period 37,308 Americans died from Covid-19. Every diagnosis has something called and ICD-10 code (International Classification of Disease version 10) and the Covid-19 code is U07.1. In the United States only a licensed Allopathic Physician (M.D. or D.O.) can diagnose; it is the right granted to their cartel by the government. It is worth noting there is yet a second column of pneumonia deaths that also have Covid-19. Pneumonia is an infection in one or both lungs. Bacteria, viruses, and fungi cause it. The infection causes inflammation in the air sacs in your lungs, which are called alveoli. The alveoli fill with fluid or pus, making it difficult to breathe. It is not clear if the pneumonia co-morbidity with Covid-19 is added to or is part of the 37,308. However, it is clear that pneumonia deaths during this period or much greater than Covid-19 some 64,382. Where is the concern for the national pneumonia nightmare, it is clearly greater?
Deaths involving coronavirus disease 2019 (COVID-19), pneumonia, and influenza reported to NCHS by jurisdiction of occurrence, United States. Week ending 2/1/2020 to 4/25/2020.*
Data as of May 1, 2020
| Jurisdiction of Occurrence | COVID-19 Deaths (U07.1)1 | Deaths from All Causes | Percent of Expected Deaths2 | Pneumonia Deaths (J12.0–J18.9)3 |
Deaths with Pneumonia and COVID-19 (J12.0–J18.9 and U07.1)3 |
Influenza Deaths (J09–J11)4 |
| United States5 | 37,308 | 719,438 | 97 | 64,382 | 16,564 | 5,846 |
| Alabama | 152 | 12,426 | 91 | 769 | 42 | 83 |
| Alaska | – | 856 | 79 | 41 | – | – |
| Arizona | 194 | 15,859 | 101 | 1,115 | 102 | 105 |
| Arkansas | 32 | 7,872 | 94 | 527 | 10 | 67 |
| California | 1,224 | 69,721 | 98 | 6,029 | 714 | 552 |
| Colorado | 551 | 10,846 | 104 | 972 | 328 | 91 |
| Connecticut | 120 | 1,398 | 15 | 130 | 34 | 18 |
| Delaware | 53 | 2,034 | 85 | 123 | 24 | 14 |
| District of Columbia | 66 | 1,464 | 92 | 173 | 66 | – |
| Florida | 809 | 54,225 | 99 | 3,934 | 445 | 282 |
| Georgia | 460 | 19,740 | 91 | 1,306 | 212 | 94 |
| Hawaii | – | 2,830 | 94 | 185 | – | 18 |
| Idaho | 44 | 3,553 | 96 | 195 | 13 | 24 |
| Illinois | 1,296 | 29,232 | 104 | 2,724 | 722 | 171 |
| Indiana | 494 | 16,503 | 95 | 1,526 | 266 | 121 |
| Iowa | 78 | 7,447 | 94 | 531 | 20 | 80 |
| Kansas | 89 | 6,582 | 94 | 455 | 40 | 85 |
| Kentucky | 117 | 10,855 | 86 | 969 | 67 | 86 |
| Louisiana | 920 | 11,401 | 95 | 902 | 400 | 63 |
| Maine | 40 | 3,824 | 100 | 318 | 11 | 30 |
| Maryland | 710 | 13,780 | 105 | 1,256 | 286 | 110 |
| Massachusetts | 2,009 | 17,802 | 112 | 2,088 | 735 | 150 |
| Michigan | 1,851 | 26,994 | 106 | 2,657 | 892 | 221 |
| Minnesota | 169 | 11,352 | 99 | 832 | 60 | 113 |
| Mississippi | 186 | 8,064 | 99 | 737 | 90 | 51 |
| Missouri | 196 | 15,163 | 89 | 971 | 68 | 169 |
| Montana | – | 2,248 | 84 | 132 | – | 32 |
| Nebraska | 21 | 3,971 | 90 | 306 | – | 27 |
| Nevada | 134 | 6,431 | 96 | 534 | 106 | 36 |
| New Hampshire | 56 | 3,207 | 99 | 224 | 18 | 29 |
| New Jersey | 5,109 | 26,794 | 131 | 4,341 | 2,546 | 110 |
| New Mexico | 36 | 4,113 | 85 | 291 | 22 | 25 |
| New York6 | 4,920 | 32,144 | 122 | 5,148 | 2,541 | 188 |
| New York City | 11,425 | 31,247 | 219 | 6,285 | 4,199 | 862 |
| North Carolina | 0 | 10,727 | 43 | 639 | 0 | 127 |
| North Dakota | – | 1,546 | 85 | 140 | – | 18 |
| Ohio | 172 | 27,169 | 82 | 1,554 | 74 | 227 |
| Oklahoma | 117 | 8,768 | 84 | 782 | 43 | 90 |
| Oregon | 77 | 8,438 | 89 | 453 | 34 | 59 |
| Pennsylvania | 1,385 | 28,073 | 78 | 2,164 | 552 | 176 |
| Rhode Island | 55 | 2,235 | 82 | 124 | 13 | 23 |
| South Carolina | 150 | 12,807 | 101 | 786 | 56 | 91 |
| South Dakota | – | 1,898 | 89 | 149 | – | 21 |
| Tennessee | 134 | 18,441 | 95 | 1,386 | 67 | 119 |
| Texas | 446 | 49,284 | 93 | 3,669 | 179 | 311 |
| Utah | 30 | 4,697 | 96 | 279 | 11 | 39 |
| Vermont | 42 | 1,570 | 104 | 108 | 10 | 14 |
| Virginia | 351 | 17,751 | 99 | 1,000 | 112 | 104 |
| Washington | 527 | 14,141 | 95 | 1,176 | 281 | 98 |
| West Virginia | 13 | 5,048 | 85 | 369 | – | 57 |
| Wisconsin | 209 | 13,718 | 100 | 786 | 32 | 145 |
| Wyoming | – | 1,149 | 99 | 92 | – | – |
| Puerto Rico | 65 | 5,201 | 0 | 737 | 33 | 28 |
—
P.S. The government explanation for this data is as follows:
“Understanding the Numbers: Provisional Death Counts and COVID-19
 Pale Rider: The Spanis...
Best Price: $24.05
Buy New $15.49
(as of 04:12 UTC - Details)
Provisional death counts deliver our most comprehensive picture of lives lost to COVID-19. These estimates are based on death certificates, which are the most reliable source of data and contain information not available anywhere else, including comorbid conditions, race and ethnicity, and place of death.
Pale Rider: The Spanis...
Best Price: $24.05
Buy New $15.49
(as of 04:12 UTC - Details)
Provisional death counts deliver our most comprehensive picture of lives lost to COVID-19. These estimates are based on death certificates, which are the most reliable source of data and contain information not available anywhere else, including comorbid conditions, race and ethnicity, and place of death.
How it works
The National Center for Health Statistics (NCHS) uses incoming data from death certificates to produce provisional COVID-19 death counts. These include deaths occurring within the 50 states and the District of Columbia. COVID-19 deaths are identified using a new ICD–10 code. When COVID-19 is reported as a cause of death – or when it is listed as a “probable” or “presumed” cause — the death is coded as U07.1. This can include cases with or without laboratory confirmation.
Why these numbers are different
Provisional death counts may not match counts from other sources, such as media reports or numbers from county health departments. Our counts often track 1–2 weeks behind other data for a number of reasons: Death certificates take time to be completed. There are many steps involved in completing and submitting a death certificate. Waiting for test results can create additional delays. States report at different rates. Currently, 63% of all U.S. deaths are reported within 10 days of the date of death, but there is significant variation among jurisdictions. It takes extra time to code COVID-19 deaths. While 80% of deaths are electronically processed and coded by NCHS within minutes, most deaths from COVID-19 must be coded manually, which takes an average of 7 days. Other reporting systems use different definitions or methods for counting deaths.”
 How Long Can Biden Stay in His Basement?