

The fast money and robo-machines keep trying to ignite stock rallies, but they all fizzle because bad karma is beginning to infect the casino. That is, apprehension is growing among whatever adults are left on Wall Street that 84 months of ZIRP and $3.5 trillion of Fed balance sheet expansion, aka money printing, didn’t do the trick.
Not only is the specter of recession growing more visible, but it is also attached to a truth that cannot be gainsaid. Namely, having stranded itself at the zero bound for an entire business cycle, the Fed is bereft of dry powder. Its only available tools are a massive new round of QE and negative interest rates.
But these are absolutely non-starters. The former would provoke riots in the financial markets because it would be an admission of total failure; and the latter would provoke a riot in the American body politic because the Fed’s seven year war on savers and retirees has already generated electoral revulsion. Bernie and The Donald are not expressions of public confidence in the economic status quo.
So the dip buying brigades have been reduced to reading the tea leaves for signs that the Fed’s four in store for 2016 are no more. Yet even if the prospect of delayed rate hikes is good for a 50-handle face ripping rally on the S&P 500 index from time to time, here’s what it can’t do. The Fed’s last card—-deferring one or more of the tiny interest rate increases scheduled for this year——cannot stop the on-coming recession.
And it is surely coming. We got one more powerful indicator on that score in this morning’s data on core capital goods orders (i.e. nondefense excluding aircraft). Not only were they down sharply from last month, but at $65.9 billion were down 11% from the September 2014 peak, and are also now below the prior cyclical peaks in early 2008 and 2001.
In fact, core CapEx orders in December were at a level first reported in April 2000, and that’s in nominal dollars. In real terms, they are down nearly 25%.
Needless to say, there will be pandemonium in the casino when the downturn is no longer deniable. That’s because the main prop under the market today is, in fact, the Wall Street mantra that bear markets never happen in the absence of a recession and that none is purportedly visible.
On that score, it is no use listing and documenting all the flashing red lights or that the BLS jobs report is both a lagging indicator and virtually worthless. Today in a nearby column, Lance Roberts reminds that at the top of the cycle the BLS nearly always over-reports employment gains, and that these estimates get revised away in the four subsequent iterations of the data over the next several years.
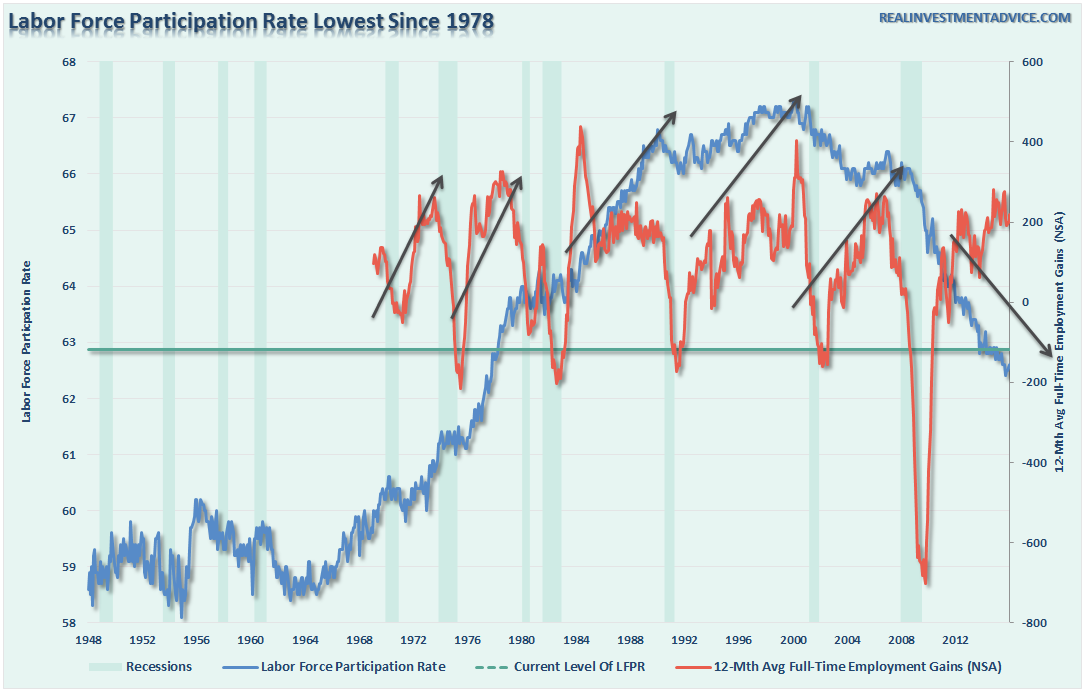
But in the current context, he thinks there is something especially fishy. Namely, that the continuing decline of the labor market participation rate is not consistent with the allegedly robust job count gains, and also it is not consistent with any prior historical relationship between the two.
But here is the potential problem for the Fed’s dependence on current employment data as justification for tightening monetary policy – it is likely wrong. Economic data is very subject future revisions. While the current employment data has indeed been the strongest since the late 1990’s, there is a probability that the data is currently being overestimated.
The reason is shown in the chart below.
If the employment gains were indeed as strong as the Fed, and the BLS, currently suggest; the labor force participation rate should be rising. This has been the case during every other period in history where employment growth increased. Since the financial crisis, despite employment gains, the labor force participation rate has continued to fall.
No, the consumers of America cannot shop the nation out of recession, either. That would take robust job and earnings gains, which are not happening, or a new round of household leverage gains, which are not remotely feasible given the condition of “peak debt” now prevalent.
On this score, we reported the other day that the vaunted strength of auto sales was actually nothing of the kind; and that we are likely at the turning point in the auto sales recovery cycle because virtually anyone who can fog a rear view mirror has already been given a car loan.
Indeed, during the past 12 months auto dealer sales rose by $65 billion but vehicle loans outstanding soared by $90 billion to an all-time high! The surging dealer lots would actually have been even more flooded with unsold cars without this final injection of cash to the bottom of the credit ladder.
Still, the talking heads keep telling you that households have substantially deleveraged and are fixing to embark on a new spending spree.
No they are not. After a few quarters of reduction owing to the massive write-downs of mortgage debt after the crisis, household debt has again crept higher. In fact, it is up by nearly $1 trillion since the late 2011 lows; and at 180% of wage and salary income remains drastically elevated by all historical standards.
Wall Street never forecasts a recession, of course. Not even when powerful indicators like the soaring inventory-to-sales ratio suggest that a downward production and income adjustment is just around the corner.
In fact, as of the most recent data, total business sales—–manufacturing, wholesale and retail—–were down by nearly 4% from their mid-2014 peak. And the ratio of inventory to sales has shot up to levels last posted in October 2008.
Business sales and investment are the heart of the equation. When they head south, the recession is just around the corner. It is only after the fact that the nation’s stock market obsessed C-suites get around to unloading excess labor inventories.
In the meanwhile, the sell-side does its level best to keep the dying bull alive with its own hockey stick projections. At the moment, the all is awesome chorus insists that what will be another negative growth earnings season should be ignored. That’s because its just the energy industry profits plunge rotating through the year-over-year comparisons.
Needless to say, by the second half of this year and 2017 it will all be blue skies again. In fact, the current consensus EPS for 2017 is no less than $141 per share on the S&P 500. And at today’s closing price of 1893 that’s a PE multiple of just 13.4X. No sweat!
Then again at the comparable point in the 2015 earnings cycle—-that is, February 2014—-the Wall Street hockey stick pointed to $137/per share. After three-quarters of actuals and the downgraded estimates for Q4, that number has plummeted to $106 per share; and that’s after excluding about $12 per share of inconvenient “ex-items” stuff like restructuring charges, plant closings, lease write-offs, stock option costs and much more.
In fact, however, the actual GAAP earnings reports, which are filed with the SEC and signed off by the CEO and CFO on penalty of jail time, are pointing in a decidedly different direction. Reported GAAP earnings peaked at $106 per share on the S&P 500 more than a year ago for the LTM period ending in September 2014.
By the most recent reporting period they were down by 14.4% to $90.66 per share, and there is no reason to believe that this slide will rebound when the Q4 numbers are actually tallied.
Here’s the thing. This exact pattern occurred during the 2007-2009 collapse. While the Wall Street hockey sticks were projecting earnings of $120 per share or more for 2008, actual GAAP earnings starting falling in the June 2007 LTM period, and kept plunging until they hit bottom at $7 per share in June 2009.
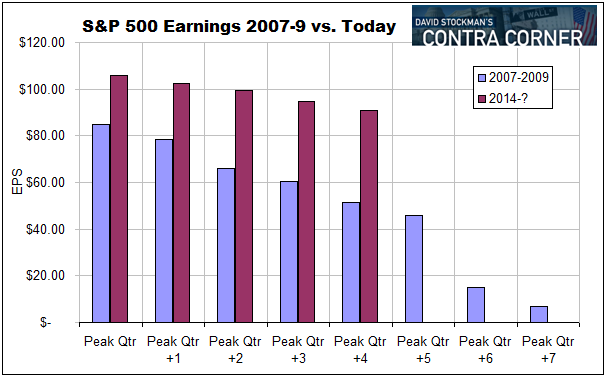
The blue bars mark the death throes of a dying bull last time. Self-evidently, this one—market in red—– is not far behind.
Reprinted with permission from David Stockman’s Contra Corner.

