


As of June 2008 no Wall Street banking house was predicting a recession, yet by then the Great Recession—–the worst economic downturn since the 1930s—– was already six months old, as per the NBER’s subsequent official reckoning.
Actually, it was already several years old if you concede that the phony housing boom of 2005-2007 was generating merely transient “statistical” GDP, not permanent gains in main street wealth. Even the movie houses now showing “The Big Short” have some pretty palpable reminders on that point——not the least being the strip club dancer who owned 5 residential properties, with two adjustable rate mortgages on each.
In fact, by then main street America was crawling with strippers. That is, equity strippers who were repeatedly doing “cash out” refinancings in order to generate between $20,000 and $100,000 or more of mortgage proceeds to spend on vacations, cars, man caves, aspirational leather goods, shoes and apparel, among much else.
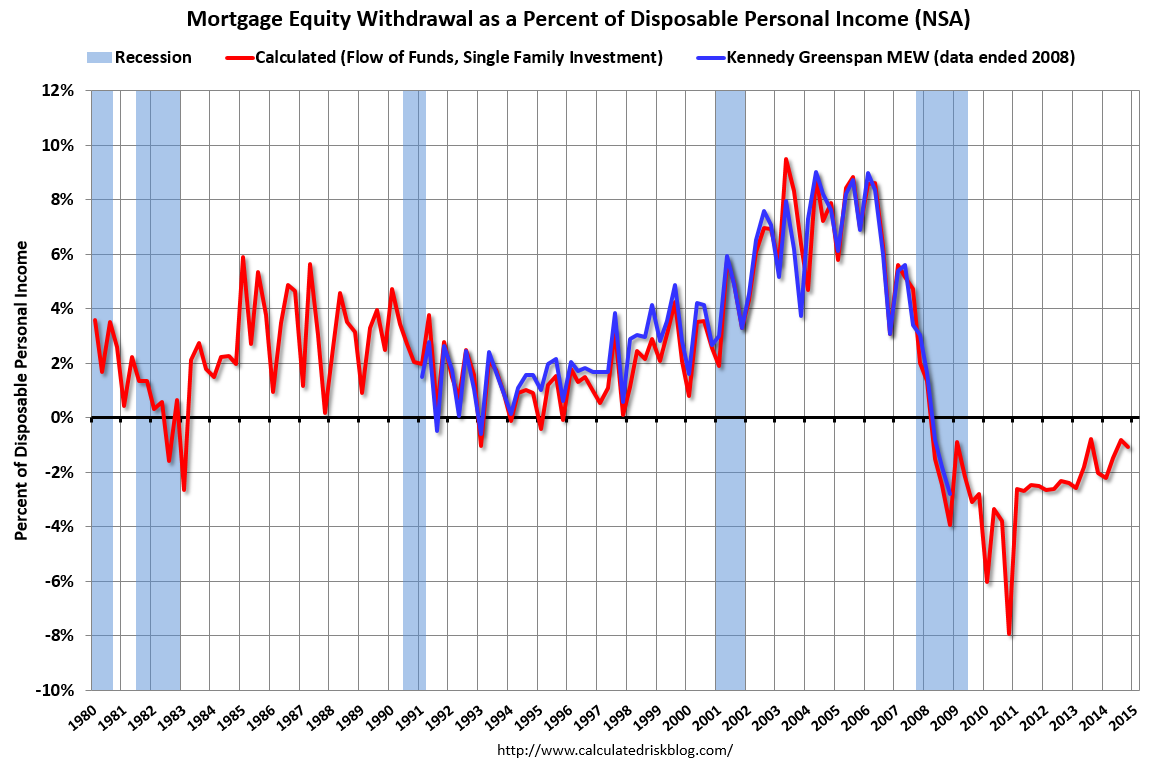
At the peak in 2006-2007, upwards of 10% of personal consumption expenditures were accounted for by MEW (mortgage equity withdrawal). The utter unsustainability of that kind of Potemkin prosperity goes without saying, but the point here is that it was no deep dark secret buried in the economic entrails.
In fact, Chairman Greenspan went to great lengths to publicize the facts of MEW on an up-to-date basis. But he wasn’t trying to warn that the end was near. Unaccountably, he and his Wall Street acolytes concluded that the US economy had become virtually recession proof because of the extra firepower being accorded to household consumption by MEW!
In short, the economic booby trap of MEW was hiding in plain sight and so was the Great Recession. Yet there was nothing at all unusual about the 2008 recession call miss.
Wall Street never predicts a recession. And that’s basically why the stock market goes up for 5-7 years on a slow escalator, and then plunges down an elevator shaft during several quarters of violent after-the-fact retraction when an economic and profits downturn has already arrived.
Needless to say, there are plenty of economic booby traps hiding in plain sight this time, too. Yet the sell side was out over the weekend with noisy chatter about stocks now being on sale at a discount, and that selective buying of the dip is once again in order.
According to these Keynesian Cool-Aid drinkers, the US economy is doing “just fine” because job growth is robust, real wages are rising and the consumer is fixing to commence a shopping spree at any moment now. And since stocks have purportedly never gone deep into bear market territory in the absence of a recession, what’s to worry?
How about the fact that there are booby traps like MEW lurking in plain sight everywhere—both at home and abroad? For example, consider the allegedly robust condition of auto sales.
During the last 12 months, retail sales of autos were up 6.1% or by $65billion. But then again, auto loan paper outstanding was up by nearly $90billion!
That’s right. Auto lenders—especially the legions of subprime nonbank operations that have sprung up with junk bond financing——have been extending credit to anyone who can fog a rear view mirror. Indeed, since mid-2010 when the auto recovery incepted, auto credit outstanding is up by $340 billion or by 90% of the $375 billion gain in auto sales.
Needless to say, virtually 100% debt financing of an auto sales boom is no more sustainable than was the MEW financing of household consumption last time around. Like then, the pool of credit worthy borrowers has been depleted, meaning that it is only a matter if time before the debt-fueled auto boom of recent years goes pear-shaped.
In this particular instance, it’s all about the fragile condition of the used vehicle market. At present upwards of 80% of all new car sales are either leased or loan financed. But leasing economics depend heavily on the “residual” or resale value of the vehicle and loan financing late in the sales recovery cycle depends on the ability of the marginal buyer to generate enough trade-in value to qualify for a new loan–even at today’s 120% LTV ratios.
As one industry analysis recently noted, when used car prices roll over, new vehicle demand gets whacked:
But it will mean a double whammy for new-car buyers. Greater supply will mean lower prices for used vehicles, thus reducing the trade-in value of a shopper’s current vehicle.
In addition, those lower prices could wallop lease terms. Typically, monthly lease payments are lower than monthly loan payments for the same vehicle because the financing institution doesn’t charge for the vehicle’s residual value — the amount it will be worth at the end of the lease. Falling used-vehicle prices will bring falling residual prices, with the consumer having to pay more to make up the difference. Automakers increasingly have relied on leasing to offset higher sticker prices, but that may not be as effective starting in 2016.
And that’s where the skunk in the woodpile is hiding. During the next 5 years a veritable tsunami of used vehicles will come off lease and loan and flood the used car market, thereby reversing the virtuous cycle of debt fueled new car sales that may well have peaked last fall.
Thus, in 2009 nearly 2.5 million vehicles came off lease, but by 2012 that number was down to 1.56 million owing to the 2007-2009 auto sales collapse. By contrast, an estimated 3.1 million vehicles will come of lease in 2016, 3.4 million in 2017 and upwards of 15 million in the next four years.
Like in the earlier cycles shown below, therefore, used car prices are certain to weaken sharply. And that’s in the opinion of NADA, the auto dealers association:
An expanding inventory of off-lease used vehicles will gradually reduce used-vehicle prices during the next few years……… It’s estimated conservatively that used-vehicle prices could fall by 2.5% per year over the next three years. That would be down 7.3% in 2018 from 2015. This drop would mean that used-vehicle prices would be at their lowest point since 2010.
In turn, prices back at the recession period levels shown below will dry up the pool of credit eligible borrowers and send the leasing market into a tailspin as losses surge and new lease rate adjust sharply higher.
Manheim Used Vehicle Value Index
December 2015

In short, this is just one more case of the truism that under conditions of “peak debt” new borrowings do not increase GDP on a permanent basis; they just steal sales and output from future years, thereby booby-trapping the main street economy with recession risk that the Keynesian Cool-Aid drinkers refuse to recognize.
Another area of alleged economic strength is housing. But that’s largely an illusion that fails to account for the hangover effect of the pre-2008 binge.
To wit, the value of private residential construction put in place during November 2015 was up by about 11% compared to prior year, but at a $428 billion annual rate it was still in the sub-basement of historical results. The year-on-year gain accounted for just 8% of the growth in nominal GDP over the past year, reflecting the fact that residential construction has now diminished to a rounding error at just 2.4% of GDP.
As shown below, actual outlays for private residential construction in November had just recovered to the April 2003 level, and that was in nominal terms. In fact, real outlays are still 25% below where they were a decade ago when the Greenspan housing boom was just getting started.
Moreover, the composition of the $428 billion run rate of private residential construction investment is even more telling. In constant 2015 dollars of purchasing power, investment in single family housing completions was $400 billion in 2003 compared to just a $225 billion annual rate in November 2015. So single family construction is still nearly 45% below its 2003 level.
By contrast, what it up in unit and dollar terms is multi-family housing units, owing to the fact that the post-crisis plunge in the homeownership rate has spurred demand for rental units. Unfortunately, the average value for a multi-family unit put in place during November was $135,000 compared to $350,000 for single-family units.
Thus, even though multi-family unit starts are now well above the 2003 level, the contribution to GDP growth has not been commensurate. In fact, during November constant dollar investment in multi-family housing was running just $11 billion above its 2003 level, while investment in single family units was down by $125 billion at an annual rate in constant dollars.
Likewise, more than one-third of the total outlays for private housing construction shown above are for home improvements, not new construction. The skunk in the woodpile there is that home improvement spending is heavily concentrated in the top quartile of households and is also highly correlated to the stock averages.
To wit, spending on renovations and home improvements included in the $428 billion run rate of private housing construction peaked at $175 billion(2015 dollars) in 2005, but then plunged by 30% to about $120 billion at the 2009 stock market bottom.
Since then, home improvement spending has recovered to about $145 billion in November 2015, but is absolutely at risk in the event of a deep stock market correction.
Indeed, the housing card is a ridiculously thin leaf on which to predicate economic “strength”. At the end of the day, the only sustainable housing rebound is concentrated in the low dollar value rental unit sector. Last’s year’s gain of $11 billion at an annual rate amounted to exactly 1.7% of the pick-up in nominal GDP.
Reprinted with permission from David Stockman’s Contra Corner.

