


Time For Torches & Pitchforks——-The Little Guy Is About To Get Monkey-Hammered Again
January 1, 2016
The reputations of Ben and Janet are going to be eviscerated in 2016. That’s because the US economy will slide into recession in defiance of every claim they have made for their snake oil monetary policies. The plain fact is, massive falsification of financial markets via their “wealth effects” doctrine did not levitate main street prosperity at all; it just fueled another giant speculative mania in the Wall Street casino.
The prospect that the leaders of our monetary politburo are about to be tarred and feathered by economic reality might be satisfying enough if it led to the repudiation of Keynesian central planning and a thorough housecleaning at the Fed. Unfortunately, it will also mean that tens of millions of retail investors and 401k holders will be taken to the slaughterhouse for the third time this century.
And this time the Fed is out of dry powder, meaning retail investors will never recover as they did after 2002 and 2009. Moreover, the overwhelming share of main street losses will be the among baby-boom demographic——sixty and seventy something’s who will be down for the count.
As Jim Quinn so graphically put it an the adjacent piece,
Investors are lazing around the waterhole like unsuspecting gazelles. This herd will be running for their lives in the near future, as danger is lurking.

With each passing day the evidence mounts, and this morning’s trade data was a doozy. During November exports shrank by 2% and are now down 12% from the peak, and at the lowest level since March 2010.
Yes, you can count on the Keynesian paint-by-the-numbers crowd to insist that exports don’t matter that much. Goods exports are just 8% of GDP and total exports including services are 12%.
So what is 12% when Janet is busy at the Fed’s dashboard, tweaking the dials and thereby goosing the labor market back to the pink of full employment health?
Well, let’s just say it again. Exports are a leading indicator because they foretell a shrinking world economy and the gathering implosion of the 20-year global credit bubble that vastly distorted and bloated the entire economic life of the planet. Among much other havoc stemming from Great Deflation now underway will be a body-blow to the supersized but unsustainable corporate profits that were generated by the credit bubble.
By contrast, the seasonally maladjusted and trend-cycle juiced monthly BLS labor report is a thoroughly lagging indicator. And its an especially egregious victim of the Fed’s Bubble Finance regime.
To wit, the massive flood of free money into the canyons of Wall Street not only unleashed its gambling instincts like never before, but also turned the C-suites of corporate America into stock trading rooms.
Accordingly, corporate executives have become so obsessed with financial engineering and capturing stock option winnings that their principal lens on reality has become the Fed juiced stock averages. That makes them bullish in the extreme and hoarders of labor until the bubble bursts.
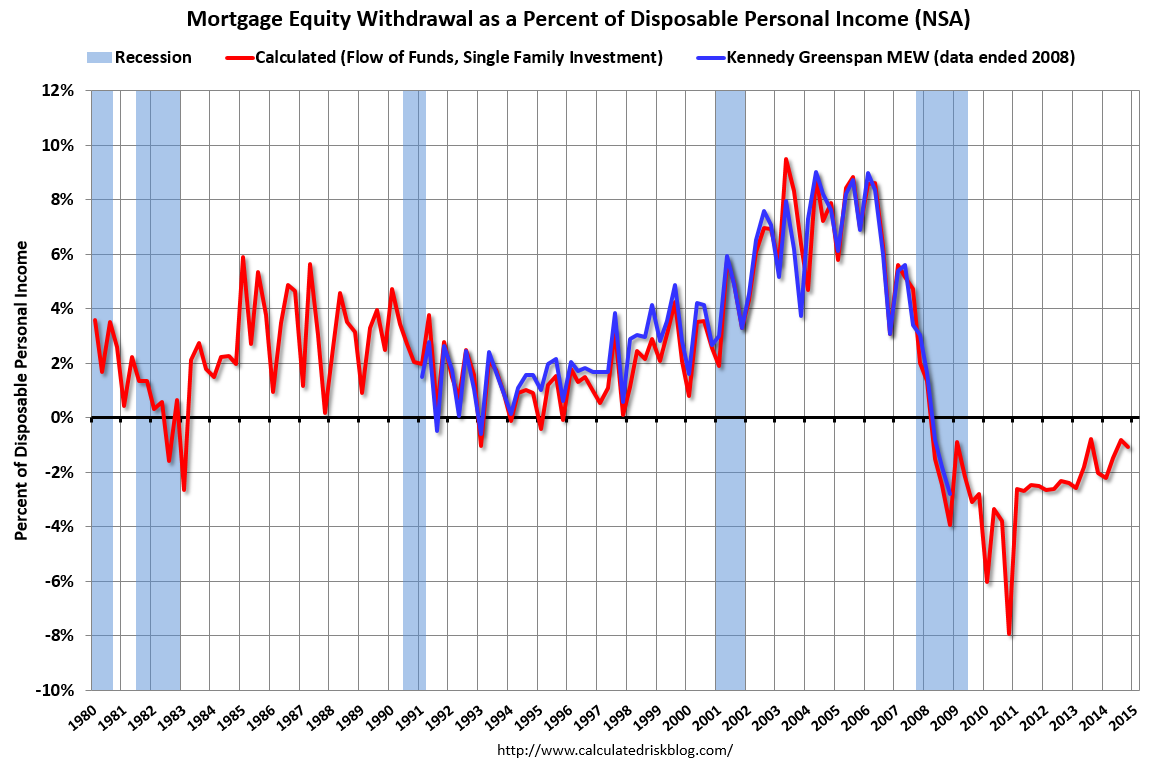
As a reminder, consider again what happened during the Greenspan housing/credit bubble. Anyone paying a modicum of attention could have seen that an unsustainable boom in housing prices and mortgage finance was underway, and that when the music finally stopped there would be a sharp downshift in household spending and extraction of credit from phantom home price appreciation.
The fact is, even Greenspan did not try to hide the phony prosperity, but actually publicized the massive amount of MEW (mortgage equity withdrawal) that was artificially ballooning the US economy. At its peak in 2006-2007, mortgage equity extraction accounted for upwards of 10% of disposable personal income.
So even though this was evident by 2005 or shortly thereafter, how did corporate America manage the labor cycle?
Why they adhered to the stock market averages in a perfect cheek-by-jowl manner! That is, the BLS jobs count is now an indefatigably lagging indicator divorced from the real main street economy; it rides the escalator up the financial bubble cycle and is slammed down the elevator when the bubble bursts.
Thus, it took 60 months for nonfarm payrolls to rise by 8 million jobs—-from roughly 130 million to 138 million between early 2003 and January 2008. Then in the next 20 months lay-offs soared and the entire 8 million job gain was wiped out.
Needless to say, the BLS’ nonfarm payroll count peaked at 138.4 million just two months after the stock market peaked in November 2007. From there both careened down the slippery slope of a Fed induced financial bubble collapsing on its own weight.
Yet back then neither Bernanke, Yellen (she was then Vice-Chair of the Fed) nor the rest of their Keynesian posse saw the recession coming—even when it was already well underway. Indeed, watching the BLS Jobs Friday count—–which by mid-2008 stood at 137 million or just shy of its all-time high—they saw no reason for alarm.
Then the market plunged and the C-suite panicked. Six million jobs—-most of which would never have been created in the first place absent the Greenspan housing/credit bubble—-were deep-sixed within less than a year.
Needless to say, here we are again with the monetary politburo gumming about their success in reviving the US economy based on sharply improved “labor market conditions” and a steadily rising BLS jobs count. And once more the Wall Street stock peddlers are beckoning the retail sheep to the slaughter based on the utterly foolish proposition that the Fed is raising rates after 84 months on the zero bound because the labor market and US economy are so strong.
No they aren’t! This time the C-suite has adhered to the Bernanke-Yellen bubble curve even more slavishly than they did during the Greenspan boom. Unfortunately, two year from now the lines on the chart below will have plunged sharply toward the lower right.
Forget the BLS’ completely manipulated and medicated jobs numbers. The fast money has already realized that the jig is up. The Fed is out of options, recession is coming to these shores in a gale force from a faltering global economy and financial risk is rapidly coming out of hiding.
The sharp flattening of the yield curve is one clear sign. The 2s30s, in fact, is at levels last reached in early 2008.

Likewise, the overnight general collateral rate is at 0.55%, the highest that it has been in over 7 years.

What happens in an environment when risk comes back out into the open? As we have learned twice this century already, the whole house of financial cards comes crashing down.
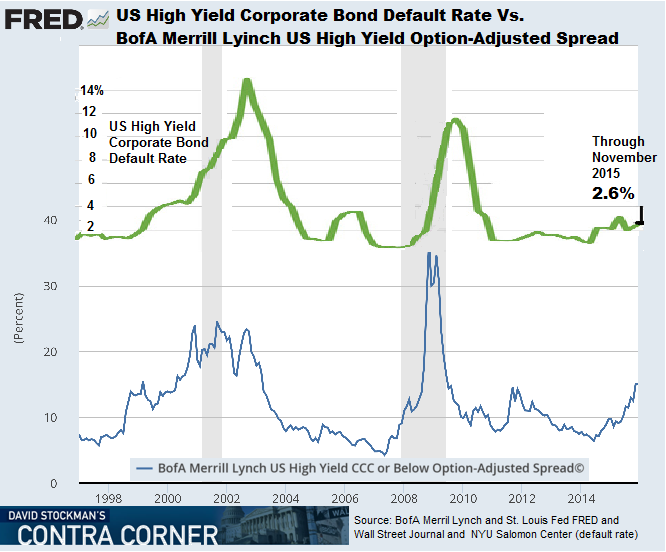
The unfailing leading indicator that another Fed-driven financial bubble is fixing to collapse is the CCC junk yield. As is evident below, it is already knocking on the door of 20%, and the calamity of defaults in the oil patch, mining sector, retail and much more is just getting started.
In fact, bond defaults will be the transmission channel by which the global deflation pounds the Wall Street casino and brings another recession cycle to main street. In that respect, one of the most egregious evils of ZIRP and financial repression is that they prolong and distend the bad credit cleansing cycle.
This year, for example, only the tip of the default iceberg emerged in the shale patch because dozens of insolvent companies were able to refinance and thereby extend and pretend. But when that string runs out during the months ahead, the high yield default rate will soar even above its prior historic peaks, and send the entire corporate bond market into a thundering retreat.
Under these conditions, the idea that the stock market is reasonably valued is almost criminally preposterous. Yet as we indicated yesterday, that truth is almost undetectable amidst Wall Street’s absolute deception and flim-flim on the matter of corporate profits.
The fact is, the ex-items forward hockey sticks published by the sell side stock peddlers bear no relationship to reality. In March 2014, for example, the consensus projection pointed to earnings of $137 per share on the S&P 500 for 2015; they are ending up 24% lower at $104.
By contrast, the real story lies in what has happened to honest GAAP earning since the pre-crisis peak in June 2007. To wit, compared to S&P 500 earnings of $84.92 per share at that time, per share earnings at the next peak in September 2014 amounted to $106 per share.
That’s right. Reported per share earnings growth over the seven-year period was just 3.2% annually. And a considerable share of that miserly gain was due to shrinkage of the share count owing to the massive $3 trillion of stock buybacks which have occurred during the interim.
Since the September 2014 LTM period, however, the actual earnings of the S&P 500 have been heading straight south, and in the most recent quarter clocked in at just $90.66 per share.
That’s a 15% drop and the shrinkage of earnings is just getting started. And it means that the S&P 500’s 8-year EPS growth rate since the June 2007 peak now stands at a laughable 0.82%.
That also means that on the heels of Tuesday dead cat bounce, the broad market’s trailing multiple closed in the nosebleed section of history at 22.9X.
Finally, if falling per share earnings in the face of an oncoming recession were not enough, the fact remains that profit margins are still near all-time highs. Yet if the gathering global deflation and CapEx depression mean anything, it is that the bloated profit margins which emerged during the credit boom will undergo drastic compression in a world swimming in excess capacity and malinvestment.
So believe this. Whatever savings and investments the middle-class baby-boomers have left is about to get monkey-hammered good and hard.
Reprinted with permission from David Stockman’s Contra Corner.
 The Empire of Chaos