


The Affordability Crisis and the UniParty’s Inflation Shell Game
February 14, 2026
Here’s one of the greatest certainties facing every household in America beyond the proverbial prospect of death and taxes: Namely, the monthly electric bill, as it arrives like clockwork either in the mail or by auto pay. And, according to Grok 4, there are approximately 143 million customers getting a metered bill each month.
Needless to say, the political hot potato of “affordability” does very much come to mind when you take a gander at the CPI electricity graph below. On a nationwide basis, electric bills rose by +6.7% during the first twelve months of the Donald’s second term, and that was just more of the same punishment to household budgets that has been underway since February 2020.
In fact, the average increase since then has also been 6.7% per year, meaning that there has been no deceleration during the past year; and that the contrast with the longer-term trend prior to February 2020 has not been lost on the voting public.
That is, the CPI for electricity rose by just 1.1% per annum between December 2012 and February 2020, bolstering the impression of very low steady-state inflation for basic home utilities. But owing to the abrupt climb since then, the December electric bill for 143 million households came in 40% higher on average than in February 2020.
Needless to say, that’s the part which is top of mind for hard-pressed households. In effect, they voted in November 2024 for relief from the high cumulative inflation depicted by the electric bill CPI below, not merely for a reduced rate of price increase, which in this case didn’t happen, either.
CPI for Electricity, 2012 to 2025
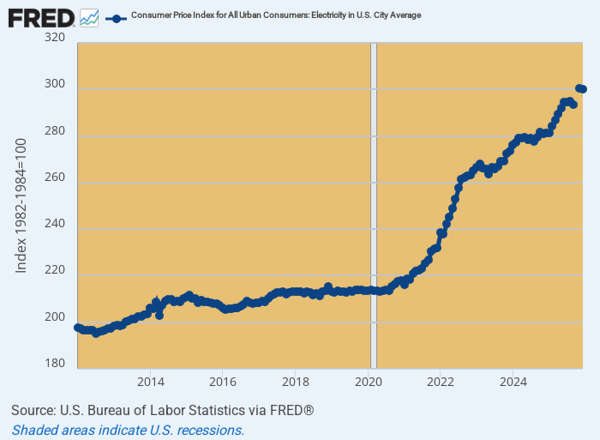
The above chart offers a powerful insight as to why the MAGA talking point about the rate of inflationary increase slowing down doesn’t resonant with the electorate. In case after case of recurring cost of living purchases, household budgets remain impaled on the high price levels for everyday goods and services which have erupted since 2020.
 The Great Deformation:...
Best Price: $4.26
Buy New $8.99
(as of 05:50 UTC - Details)
The Great Deformation:...
Best Price: $4.26
Buy New $8.99
(as of 05:50 UTC - Details)
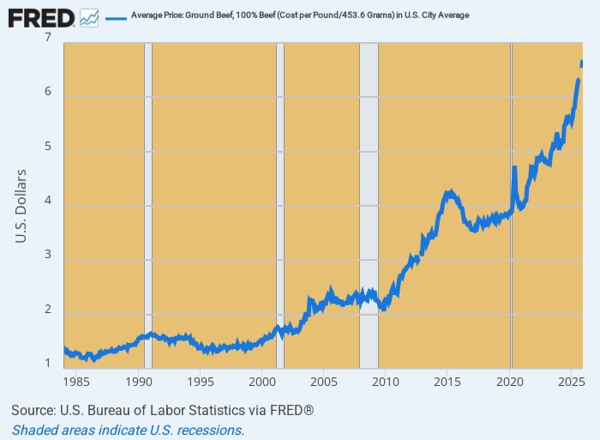
 For instance, there are about 220 million beef eaters in the US, and they know damn well that there has been no relief at all from the soaring price of beef. In fact, ground beef prices have risen from $5.61 per pound in December 2024 to $6.69 per pound in December 2025, representing a 19.3% gain during the Donald’s first year.
But that’s not the half of it. During the long 36 year period between 1984 and February 2020, the inflation rate for hamburger was 3.1% per annum. That was no bargain to write home about at all, but, as depicted by the graph below, it was moderate and reasonably steady year-to-year.
No more. At $6.69 per pound in December 2025, the price was up by +72% from where it stood on the eve of the pandemic in February 2020: In round terms, the cost of even hamburger meat has therefore risen at a 10% per annum rate for six years running.
In short, this is where the “affordability” complaint arises from: Washington’s inflation is hitting the dinner table week after week after week, and when you look at the last nine-years of the chart, the MAGA talking point that it’s all Sleepy Joe Biden’s fault doesn’t wash: The $3.13 per pound increase since December 2016 has been split roughly 50/50 between the GOP and Dem tenures in the White House.
Ground Beef Price Per Pound Increase:
- Trump 1.0 & 2.0: +$1.47.
- Sleepy Joe Biden: +$1.66.
- Total Increase: +$3.13
Ground Beef Average Price Per Pound: 1984 to 2025
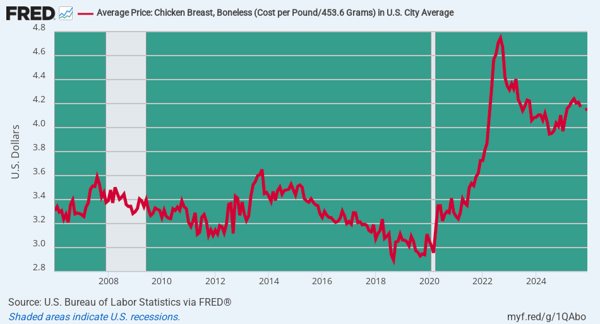
Of course, you could always say–let them eat chicken!
After all, that’s what the green eye-shades at the BLS implicitly recommend. That is, when the price of beef soars they say that isn’t inflation because some hard-pressed households switch to chicken.
And, yes, in December boneless chicken breast was priced at $4.15 per pound, which was 38% cheaper than a pound of ground beef (less the BBQ sauce). But the thing is, that pound of chicken breast was still (by coincidence) 38% higher than it had been in February 2020. So the sticker shock from cumulative price increases over the last six years is not much less severe than that for beef.
Worse still, the February 2020 benchmark came at the end of a 14-year run of falling chicken prices. As shown in the graph, the price per pound of chicken breast had posted at $3.31 in 2006 and had fallen by nearly 10% during the intervening period.
What this means, of course, is that consumers are far more aware of the hook skyward in recent years than the 5 cents per pound drop in the sticker price that has occurred during the Donald’s second watch since December 2024.
CPI for Chicken Breast, 2006 to 2025
Likewise, the preponderant share of Americans are not dairy-intolerant, but most surely are allergic to the 22% increase in the price of their milk and ice cream since January 2020—especially when this came on the heels of several years of price stability. Again, the upward hook was initially triggered by the Donald’s own disastrous policies during the pandemic in 2020.
The result of the lockdowns was supply chain disruptions and supply shortages—just as the household sector was being pumped full of free stuff from the Donald’s $2.2 trillion CARES spending bacchanalia. In combination, of course, these clashing statist initiatives practically ordered the population to remain at home watching Netflix and eating ice cream.
The fact, that the rate of increase has come to a halt during the last 12 months still doesn’t erase the sticker shock that has materialized during the past several years. Claiming that it was caused by “Joe Biden” resonates perhaps with the 25% hard core MAGA Hats in the US electorate, but it doesn’t change the reality of far higher dairy costs for most less politicized households.
 Confessions of an Econ...
Check Amazon for Pricing.
Confessions of an Econ...
Check Amazon for Pricing.
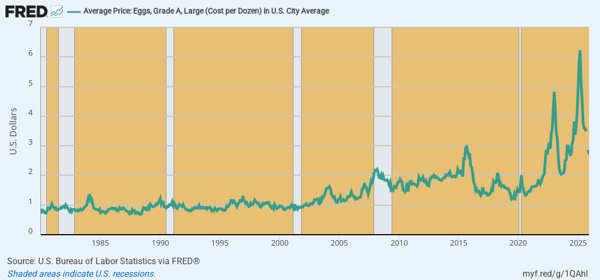
Indeed, even in the case of eggs, the MAGA talking point about egg price being way down since January 2025 is not entirely dispositive. That’s because the decline is from a drastic price peak that resembled Mt, Everest and which had been caused by the layer flocks being devastated by a virulent outbreak of the Avian Flu.
So at $2.86 per dozen in December, eggs are still more than double the $1.35 per dozen price which prevailed as recently as September 2020. In turn, that was only up slightly above the level of essentially $1/dozen that had prevailed for about 25 years running between 1980 and 2005—perhaps generating the perception that eggs prices aren’t supposed to rise.
In effect, the drastic price spikes of recent years are some form of payback to what occurred during the long 25 years of egg price stability in nominal terms and upwards of a 50% reduction in real terms. This huge gain in consumer welfare was owing to the massive industrialization of the layer flocks into huge, automatic chicken farms, which drove down costs and allowed introduction of breeding practices which maximized egg output.
Unfortunately, that also made the giant industrial layer flocks more vulnerable to the spread of deadly viruses from wild migratory birds, which, in turn, triggered rigid USDA culling mandates. The latter resulted in more than 100 million birds being culled during the 2023 and early 2025 waves, compensated for by huge USDA compensation payouts which totaled upwards of $2 billion over the three year period.
Either way, it was the UniParty policies of the the farm lobby that caused the massive excess culling and the resulting price spikes, not Joe Biden stumbling around the White House. And, of course, the sharp drop since March 2025 was due to the rebuilding of the laying flocks, not arm waving by the Donald.
Nevertheless, what remains is a MAGA talking point that egg prices are down from $4.41 per dozen during December 2024 to $2.71 in December 2025. That surely excites the MAGA faithful in the telling. Alas, however, at more than double their price level of September 2020 the message to most consumers is that eggs are still damn expensive—-more than triple their long-standing $1 per dozen price.
CPI Per Dozen For Grade A Eggs, 1980 to 2025
At the end of the day, of course, inflation is not defined by the rate of increase in any particular commodity or product sector, but by the general price level increase, or weighted average of all prices, over time. And that, in turn, is a function of the Fed’s printing presses.
Under a non-inflationary monetary policy, a reduction in the layer flocks would cause the relative price of eggs to rise, but it would also cause some other commodity prices to fall owing to the re-allocation of existing purchasing power. That is, absent an increase in fake demand financed by printing press credit.
And on that score, both parties have spent like drunken sailors and urged/endorsed/endured the Fed’s printing press monetization of all that debt. As shown in the graph below, the Fed’s balance sheet is still up by 25% from its February 2020 level, and the 16% trimmed mean CPI is is also up by 25%.
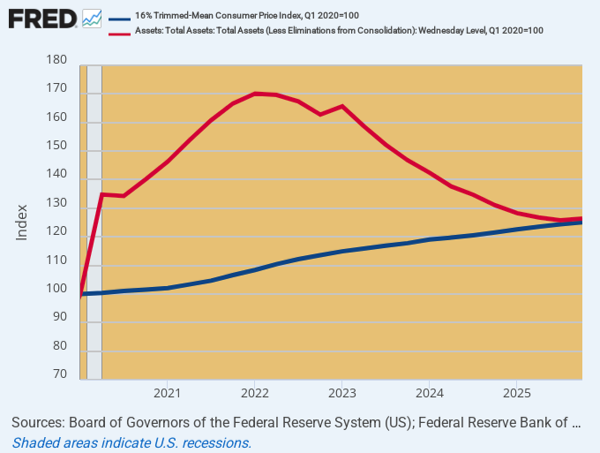
Needless to say, the embedded 4.2% average inflation rate since February 2020 is exactly why America has an affordability problem. If continued for a decade, its would result in the dollar’s purchasing power dropping to just 59 cents by the end of the period.
So the underlying excess fiat credit which emanated from the Fed during the same period is the cause of the inflation that has ebbed and flowed through various product sectors per the cases reviewed above. And, yes, the rate of CPI increase has slowed down since March 2022, but that’s because the Fed has finally attempted to trim its egregiously bloated balance sheet.
Yet and yet. The Donald is on the warpath against even the half-hearted anti-inflationary steps that have been taken by the Eccles Building.
If Trump gets his way and appoints another money-printer when Powell’s term ends in April, the recent inflation respite in the 3%+/- zone will surely re-acclerate. And then even the Donald may be forced to concede that “affordability” is no kind of hoax at all.
Reprinted with permission from David Stockman’s Contra Corner.
Copyright © David Stockman
