


Thursday was a Red Letter day for that old “you don’t say!” riposte. We are referring to the obvious response to Powell’s black and white confession to the Senate Banking Committee yesterday that more people working doesn’t cause inflation.
“The relationship between the slack in the economy or unemployment and inflation was a strong one 50 years ago … and has gone away,” Powell said Thursday during his testimony before the Senate Banking Committee. He added the strong tie between unemployment and inflation was broken at least 20 years ago and the relationship “has become weaker and weaker and weaker.”
Why, yes, it apparently has disappeared entirely per the graph below.
Since the recessionary jobs bottom in 2010, the unemployment rate (brown bars) has plunged from just under 10% to a 50-year low of 3.7% at present. Yet despite the apparent massive evacuation of labor “slack” from the US economic bathtub, real weekly earnings of prime age males (purple bars) have essentially flat-lined during the last eight years.
So you could put a stake in the so-called Phillips Curve and be done with it. But actually the story is far bigger and Powell’s confession implicates much more than merely the wage/employment equation.
To wit, it actually crushes the core tenant of Keynesian central banking. Namely, that Fed policy operates largely in a closed bathtub of domestic GDP and that by raising or lowering the water level of “demand” therein, the Eccles Building can bend domestic inflation, employment and economic growth to its will.

Self-evidently, it cannot. And the reason for that starts with Powell’s incorrect claim that the relationship between wages and employment “has gone away”.
In fact, what is implicated here is the fundamental law of supply and demand, which did not mysteriously disappear into some monetary Stranger Things realm. No, it simply migrated from the Lower 48 to a planet-wide venue.
 Peak Trump: The Undrai...
Best Price: $12.72
Buy New $43.07
(as of 11:40 UTC - Details)
Peak Trump: The Undrai...
Best Price: $12.72
Buy New $43.07
(as of 11:40 UTC - Details)

Indeed, is it not blindingly obvious that hundreds of millions of peasants have been drained from the rice paddies and villages of Asia and herded into spanking new factories funded with the cheapest credit central bankers can print?
So of course the U.S. domestic supply/demand equation has been severed per the chart above. That’s because the China Price for globally traded goods and the India Price for globally supplied services drive the geographic allocation of production and determine the marginal wage rate in the global economy.
Stated differently, the U-3 unemployment metric is about as useless as a tit on a boar. The relevant “slack” is unutilized workers in the global labor pool, and there remains plenty of them.
Stated differently, during the last 10 years of economic recovery, rising domestic demand for production and labor has leaked out of the domestic GDP bathtub into the global economy. And were domestic wages to have risen rapidly per the old Phillips Curve equation, there would have been even more production and wages shifted offshore – given that resource allocation happens on the margin in an open global economy.
In fact, there is nothing new about this demand leakage factor. Especially since Alan Greenspan’s institution of Keynesian central banking in the 1990s, the leakage factor has been growing because the Fed has refused to allow domestic financial markets to clear in the indicated deflationary direction.
Accordingly, the cost and wage gap between domestic production and venues driven by the China Price and India Price has been steadily widening. We estimate that in nominal terms, the average US wage gap with China was $10 per hour fully loaded in the late-1980s and is upwards of $25 per today.
This growing US wage/cost gap relative to offshore production is what is holding down real US wages. Yet even relatively flat real wages trends have not been enough to halt the migration of US demand to lower wage/cost foreign venues, as is more than evident in the chart below.
The chart simply indexes US imports and final sales to domestic purchasers to the base year of 1994. What it shows is that imports (purple line) have grown nearly 300% or 5.8% per annum over the past 25 years, whereas the total pool of domestic “demand” as measured by nominal sales to domestic purchasers (essentially GDP less exports and inventory swings) has risen by 195% and just 4.5% per annum.
So a materially growing share of the domestic demand pie has gone to foreigners.
The widening gap in the chart between the two lines measures the demand leakage. It’s the powerful engine of wage suppression that remains so mysterious to our monetary central planners – that is, the destroyer of the old time domestic Phillips Curve.

Of course, the chart explains a lot more than weak wages versus purportedly strong employment. It actually explains why the very idea of Keynesian demand management of the US economy is such a destructive nonstarter.
That is, in theory the Eccles Building can goose domestic demand by means of interest rate repression, which, in turn, is supposed to cause domestic sectors to borrow more and spend more than would otherwise be the case. But in a technologically and efficient transportation enabled global economy, that enhanced “demand” doesn’t necessarily bring the water-level to the brim in the domestic GDP bathtub, thereby causing wages to rise and all available domestic labor to be absorbed.
Instead, it’s a matter of prices, not aggregates. That is, if domestic wages, prices and costs are uncompetitive with foreign venues (adjusted for transportation costs, inventory carry and the like premiums on imports), self-evidently some or all of the incremental demand lands on foreign shores, where it nudges up jobs, output and wages abroad, not here.
In other words, the Fed is essentially lashing the US economy with a wet noodle – even when it manages to coax out some incremental borrowing and spending by domestic households and businesses.
But even that is now in doubt owing to three decades of money-pumping and massive growth of domestic debt and leverage. We have called it the financial equivalent of a national LBO. The latter has now brought on a condition best described as Peak Debt, which reflects the fact that a large share of domestic household and business balance sheets are tapped out.
Accordingly, cutting interest rates has increasingly less potency on main street due to the crushing absolute level of debt. As of Q1 2019, in fact, total public and private debt weighed in at $73 trillion and is up by $21 trillion from the pre-crisis peak in Q4 2007.
As shown below, there are now two turns of extra debt on the national income (3.47X versus 1.48X) compared to the long-standing leverage ratio which prevailed during the century between 1870 and 1970. In quantitative terms, those extra turns amount to $40 trillion of extra debt being lugged around by the US economy.
Needless to say, it is becoming ever harder for the Fed to stimulate more borrowing and spending relative to the nation’s $21 trillion of nominal income. It’s simply a matter of diminishing returns to small reductions in what are already rock bottom rates – coupled with the exhaustion of balance sheet capacity.
US Economy Still Freighted Down By National LBO

That’s especially the case in the household sector, where leverage soared between 1987 and the 2008 financial crisis. As shown below, that household leverage has remained at historically extreme levels relative to wage and salary income, notwithstanding some modest deleveraging in the wake of the mortgage default crisis.
Household Leverage Went From Historic 80% of Wages and Salaries to 180%

In short, the Fed’s interest rate tool is getting weaker and weaker; domestic demand growth owing to higher leverage is petering out; and what incremental domestic demand the Fed is able to stimulate is going increasingly into the purchase of foreign goods and the labor and other factors of production embedded therein.
Besides that, even the U-3 metric isn’t what it used to be in terms of measuring “slack” in the domestic labor market. That because a steadily rising share of available workers and workers’ hours are not being employed in the domestic economy – a factor that the crude headcount based U-3 measure cannot capture.
That missing labor factor is evident in the chart below. Since the Q4 2000 peak of the 1990s Tech Boom, the census of potential workers in the US economy has grown by 21%, yet labor hours actually deployed have risen by only 11.9%.
So the true labor utilization rate has fallen sharply – not withstanding the U-3 metric being reported by the BLS, which counts all jobs the same.

As we have detailed elsewhere, the adult population 20-69 years of age in the year 2000 was 175.5 million, implying annual available works hours at a standard 2000 hour year of 351 billion labor hours.
In fact, according to the BLS actual labor hours employed that year amounted to 229.5 billion, leaving 121.5 billion hours unutilized. That means the comprehensive unemployment rate stood at 34.6% at the turn of the century.
By contrast, presently the available labor pool totals 212.3 million potential workers or 424.6 billion annual hours. That compares to 255.6 billion actual hours employed during the latest reading. So the current comprehensive unemployment rate is 40.0%!
But here’s the thing. In April 2000, the U-3 unemployment rate was 3.8%, virtually identical to today’s 3.7% rate. But self-evidently, there is a lot more “slack” in the pool of domestic labor hours available today versus 19 years ago.
To be sure, the reason there are currently 169 billion unemployment adult labor hours under this comprehensive apples-to-apples measure of labor market slack is that there are more and more part-time jobs in the BLS employment count; and because people choose to work in the stay-at-home unmonetized household or black market economy or to go on welfare, disability, student loans or sell used beer cans on E-Bay from mom and pop’s basement.
Ordinarily, rising real domestic wages would, on the margin, cause hours to shift from welfare to work, studentdom to gainful employment and mom’s basement to the paid labor market. Yet with an abundant pool of cheap surplus labor abroad causing domestic real wages to stagnate, those 169 billion unused labor hours have remained outside the paid work force,
In any event, rather than see that the death of the domestic Phillips Curve means the death of Keynesian central banking as well, Powell offered the prospect that sooner or later this massive abundance of unutilized domestic labor would be absorbed and that the holy grail of monetary central planning would once again come into view.
That is, More Inflation!
 The Great Deformation:...
Best Price: $2.00
Buy New $9.95
(as of 09:55 UTC - Details)
The Great Deformation:...
Best Price: $2.00
Buy New $9.95
(as of 09:55 UTC - Details)
“At the end of the day, there has to be a connection because low employment will drive wages up and ultimately higher wages will drive inflation, but we haven’t reached that point. In many cases, that connection between the two is quite small these days,” the Fed chief said.
No it won’t. For all practically purposes there is no limit to the cheap labor pool on the planet, meaning that the wage inflation that our monetary politburo keeps promising will not happen any time soon.
Apparently, however, robust wage inflation is the monetary Godot that the Fed heads are waiting for. That means they believe they can keep “stimulating” demand and falsifying the interest rates indefinitely, thereby fueling an ever more egregious bubble on Wall Street and an even more disastrous day of reckoning when it finally bursts.
What that means, of course, is that the Fed is essentially backing itself into an unstated version of modern monetary policy (MMT). In fact, the clueless Pivoting Powell more or less conceded that in this interchange with one of its leading advocates, the very Alexandria Ocasio-Cortez.
In recent Congressional hearings with Fed chair Gerome Powell, Alexandria Ocasio-Cortez noted that over the past five years, the central bank had repeatedly suggested that unemployment could not fall much lower without triggering high inflation – only to see unemployment fall much lower without triggering high inflation.
Ocasio-Cortez: In early 2014, the Federal Reserve believed that the long run unemployment rate was around 5.4 percent. In early 2018, it as estimated that this was now lower, around 4.5 percent. Now, the estimate is around 4.2 percent. What is the current unemployment rate today?
Powell: 3.7 percent.
Ocasio: 3.7 percent…Unemployment has fallen about three full points since 2014 but inflation is no higher today than it was five years ago. Given these facts, do you think it’s possible that the Fed’s estimates of the lowest sustainable unemployment rate may have been too high?
Powell: Absolutely.
Imagine that. The route to socialism in America may end up being channeled through the big meeting room in the Eccles Building.
In the interim, however, the actual condition of the global economy is becoming steadily weaker – a condition that the Fed’s impending rate cutting campaign will do nothing to reverse.
Accordingly, when the financial bubble finally bursts, it will likely happen in the midst of a global recession, where the Fed and its convoy of central banks are finally and truly out of dry powder.
As Bloomberg noted, the overnight news was distinctively negative.
The first warning shot to the global economy came from Singapore, where Gross domestic product in the trade-reliant city state declined an annualized 3.4% in the second quarter, a plunge from 3.8% in Q1 and far below the 0.5% consensus estimate. This was the biggest drop since 2012.
Singapore’s manufacturing index contracted an annualized 6% in the second quarter from the previous three months. Construction declined 7.6%, reversing a 13.3% expansion in the first quarter. The services industry shrank 1.5% in the second quarter.
“Singapore is the canary in the coal mine, being very open and sensitive to trade,” said Chua Hak Bin, an economist at Maybank Kim Eng Research Pte in Singapore. The data “points to the risk of a deepening slowdown for the rest of Asia.”
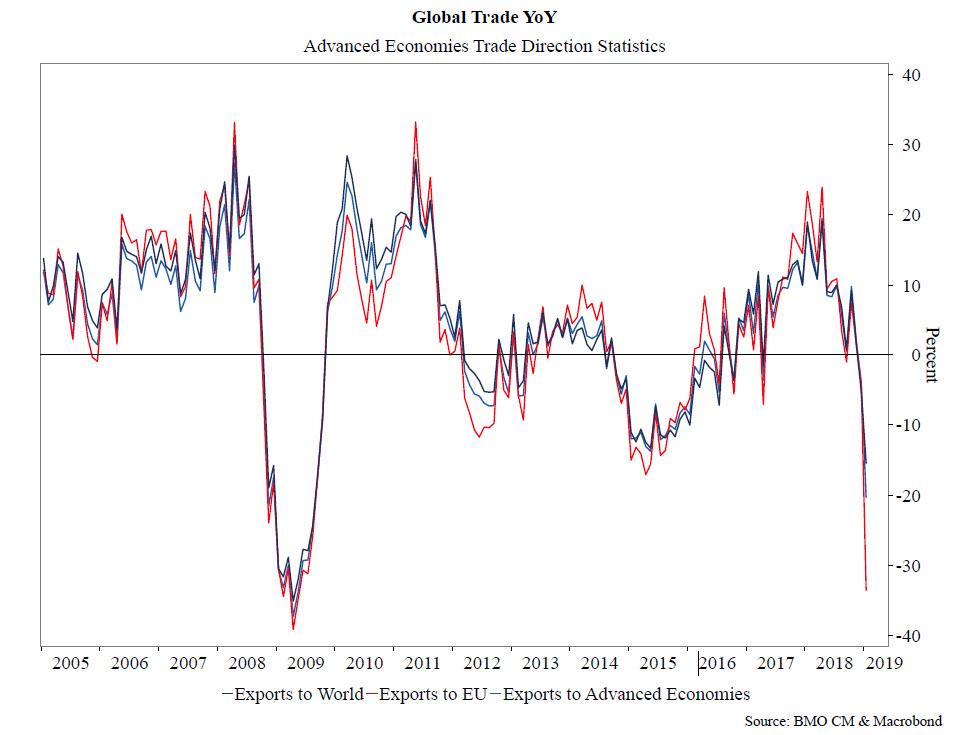
Separately, in the second blow to global trade – and the latest confirmation that China will be forced to engage in even more aggressive stimulus – Beijing’s latest trade figures showed exports fell 1.3% in June from a year ago and imports shrank a more-than-expected 7.3%.
The main culprit for the latest disappointing data? Exports to the US contracted significantly by 7.8% yoy in June, down further from -4.1% yoy in May. Exports to the EU also decelerated to a decline of 3% yoy in June from +6.1% yoy in May, and exports to Japan increased modestly by 2.4% yoy (v.s. +0.5% yoy in May). In contrast, exports to ASEAN accelerated significantly to +12.9% yoy in June from +3.5% yoy in May.
Needless to say, in his testimony this week, Powell spent considerable time gumming about these crosscurrents and risks to the outlook. Might well he did – even if his wet noodle tools can do exactly nothing about them!
Since our May meeting, however, these crosscurrents have reemerged, creating greater uncertainty. Apparent progress on trade turned to greater uncertainty, and our contacts in business and agriculture report heightened concerns over trade developments. Growth indicators from around the world have disappointed on net, raising concerns that weakness in the global economy will continue to affect the US economy. These concerns may have contributed to the drop in business confidence in some recent surveys and may have started to show through to incoming data.
Meanwhile, the budget deficit is soaring, up by 23% to $747.1 billion in the first nine months of the fiscal year, which, in turn, has caused the US Treasury Secretary to warn that Uncle Sam may run out of cash by Labor Day.
Then again, the Fed is cutting rates because its bogus Keynesian models have given it still another excuse to pleasure Wall Street.
All that, and they are once again buying the dip hand over fist.
But at least we now know that the Phillips Curve is dead. And if we are fortunate, the death of Keynesian central banking can’t be too far behind.

Reprinted with permission from David Stockman’s Contra Corner.

