


Losing Ground In Flyover America
May 28, 2016
The cowardly dithering in the Eccles Building is sucking Wall Street punters into a vortex. And it promises to be the mother of all bubble implosions.
There is no other possible outcome for a stock market that is trading at 24X reported earnings in the teeth of an enormous headwinds ever accumulated.
The intensifying global deflation/recession lapping upon these shores gets more ominous by the day. Yet that’s only the half of it.
When you take an unvarnished look at the domestic economy, the real recessionary skunk in the woodpile becomes apparent. Yet the casino is falsely capitalizing earnings as if recessions have been outlawed and the nirvana of Keynesian full-employment has become a permanent condition, world without end.
Today’s bubble vision meme that all is well because the Fed judges the economy to be strong enough to absorb 1% money market rates sometime next year is just a manifestation of that permanent full employment delusion. After all, earnings always collapse during a recession—–so implicitly there is not one in sight as far as the eye can see.
Then again, why would anyone credit the Fed’s insight into the future or even its grasp of the present? In its April minutes, for example, it noted that the world financial dangers that caused it to pause in March have now eased.
No, they haven’t. As detailed below, the only thing that changed is that China went through another flash bubble in the commodity space that is already done and gone.
In fact, the Fed has never, ever anticipated a recession——even when we were in month 118 of the 1990s technology and dot-com bubble.
Likewise, it had no clue that the housing collapse was coming and was shocked by the September 2008 Wall Street meltdown. And now it has had to revise sharply lower every single GDP forecast it has made in the years since the crisis.
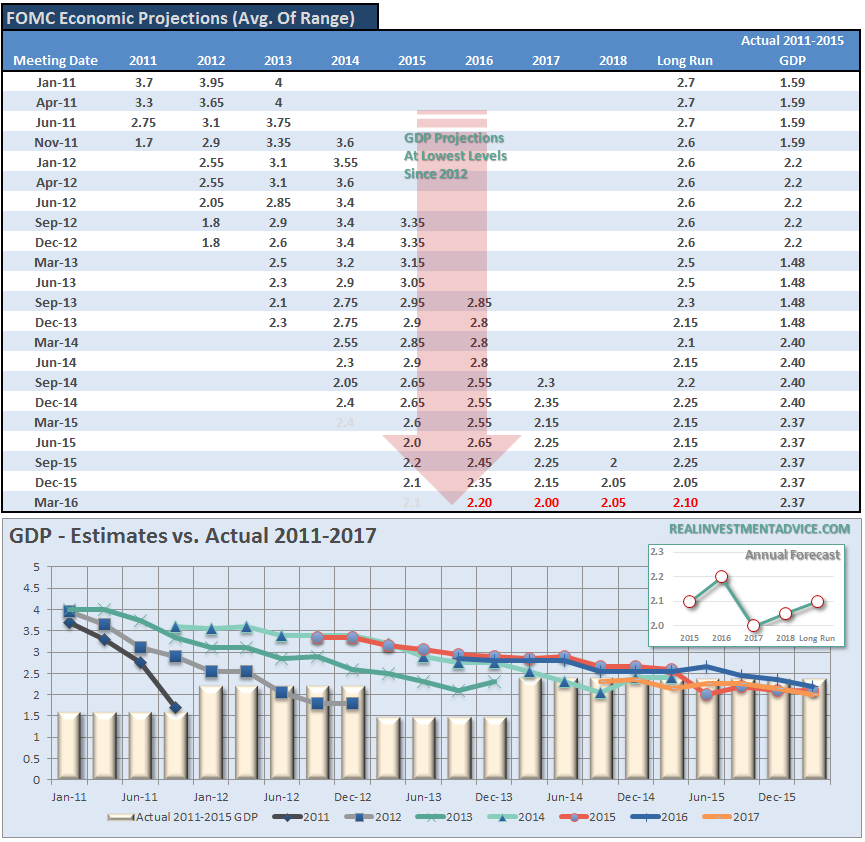
Here’s the thing. The Fed’s paint-by-the-numbers Keynesian incrementalism leaves it blind to the underlying rot in the US economy and to drastically over-estimate its capacity to maintain a stable growth equilibrium.
In fact, corporate America is being strip-mined by Fed-fueled financial engineering and flyover America is sinking irretrievably into debt, dependency and shrinking living standards.
You can’t capitalize that at 24X. And most certainly the fools who occupy the Eccles Building have no clue about the storms that are coming.
The idea that international conditions have eased, for example, is sheer idiocy. Take the most recent anomalies out of the Red Ponzi.
It appears that its latest bubble in iron ore and steel inflated white hot and then plunged abruptly——all within the span of fewer than 100 days.
And it did so in the context of excess capacity that is out of this world. That is, China has 1.3 billion tons of steel capacity and sustainable demand for 400-500 million tons at the very best. So ordinarily its industry fundamentals would have crushed prices and margins for a long time to come.
Instead, a massive surge of credit funded speculation in China’s incipient futures markets during February/March caused iron ore to rise from $40 to $70 per ton in a few weeks; and daily trading volumes to spike to such manic levels that they actually exceeded annual consumption.
Worse still, the speculative run-up in the futures markets caused idle steel mills to be re-opened—–they very opposite of the hundreds of millions of steel mill tonnage than needs to be closed.
During the past four weeks, by contrast, these same speculators have gone into a selling and liquidation frenzy, and prices will soon be back under $50 per ton. The whole episode had nothing to do with economics; it was just another eruption of China’s $30 trillion credit volcano.
Likewise, there has been a flash housing bubble, especially in the largest cities where prices briefly soared by upwards of 60% on a year over year basis. Again, this occurred in an economic backdrop that is drowning in empty apartment units. By some estimates that monumental surplus numbers upwards of 60 million units and the reason for it explains the bubble anomaly.
To wit, China’s tens of millions of real estate speculators do not want the units occupied in order to keep them shiny new; they are being purchased in lieu of stock certificates or, for the matter, lottery tickets, on the theory that real estate prices will rise forever.
In that same vein, word now comes that China’s northeastern harbors have become a parking lot for oil tankers. It seems that China loaned the OPEC have-not’s, such as Venezuela and Nigeria, upwards of $100 billion against the value of future oil deliveries. But the bulk of those loans were made when oil was above $100 per barrel, meaning that in order to avoid default these borrowers are now paying-in-kind (PIK) nearly three times more oil than was implicit in the original deals.
Accordingly, China is now receiving 1.0 million barrels per day of PIK payments, and most of that is flowing through a forest of “teapot refineries” that have sprung up in its northeastern rust belt.
Needless to say, these fly-by-night refineries did not rise to meet incremental demand for a petroleum product. Diesel demand last year was actually down nearly 10%, and the increase in the auto fleet and vehicle miles were driven did not make up the difference.
Consequently, much of the apparent increase in global crude oil demand is being indirectly routed through another Potemkin village in the Red Ponzi.
At some point soon, therefore, the massive build-up in east Asia of refined petroleum stocks from these teapots will bring oil prices crashing back into the $20s, and with it the delusion that commodities are recovering and global growth is back on track.
To the contrary, the Red Ponzi continues to deflate at an alarming rate, and it is only the leading indicator.
The veritable depression in Brazil, the plunge in Japan’s trade accounts, the sharp drop in exports and PMIs in Korea, Taiwan, Singapore and the rest of east Asia, the swirling liquidity crisis in the petrostates, 31 straight months of sales declines at CAT and other giant global equipment suppliers, the slump in German machinery and luxury vehicle exports, the near double-digit decline of US imports and rail volumes—–all speak to the global recession now approaching.
Yet even if our monetary politburo had the luxury of waiting for the massive excess capacity and unserviceable debts to be wrung out of the global economy, which will take years, it is missing the boat entirely on the domestic front. The main street America is not approaching full employment; it is tapped out and sinking to ever lower economic lows.
In a sense, Donald Trump’s shocking rise toward the presidency is a far better indicator of stress in the flyover zone of America than Janet Yellen’s entire “dashboard” of labor market indicators, which mostly measure the medicated and modeled self-referential noise published by the BLS.
The main street reality that Trump is tapping escapes our monetary central planners because they are enthralled to a lethal combination of bad ideas and bad data about inflation. As we have repeatedly stressed, the Fed’s 2.00% inflation target has no economic merit whatsoever; and basing it on the PCE-deflator less food and energy compounds the offense.
To wit, the flyover zone of America is suffering from too much inflation and too much debt. Yet the Fed’s fundamental policy is to generate more inflation and induce more borrowing. After all, what other reason could justify holding the costs of funds in the money market to essentially zero for 89 months running?
To be sure, the Fed’s argument that there is not enough inflation and that it is missing its targets from below is pretty threadbare based on its own preferred measuring stick. That is, the PCE deflator less food and energy has risen by 1.6% during the past year, 1.6% during the past 5-years and 1.7%during the 15 years since the turn of the century.
In short, there is no material change of trend, and how in the world can 30 or 40 basis points of difference from the magic 2.00% target make any difference to the growth and wealth of an $18 trillion economy anyway? Surely this is just plain academic pettifogging designed to justify the will to power in the Eccles Building and the massive daily intrusion of the FOMC in the money and capital markets.
The truth is, however, there is way too much inflation on the main street America and that’s why its real wages and living standards are sinking ever lower. To document that fundamental proposition we have modified the CPI to include a heavier weight for the four horsemen of inflation—–food, energy, medical and housing——that hammer the budgets of the overwhelming bulk of main street households.
To that end, we have replaced the phony OER (owners equivalent rent) which accounts for nearly 25% of the CPI with a market-based index of asking rents. Likewise, we have substituted the comprehensive Milliman index of medical costs for the systematically understated medical components sub-index of the CPI and have raised its weight from 8.5%, which vastly understates what main street households spend for premiums, deductibles, copays and uncovered expenses, to 10.5%.
In addition, the combined weight of food and energy has been increased from 20.5% of the CPI to 22.5%. Altogether, then, the four horsemen of inflation account for 65.0% of our “flyover CPI” index compared to 61.0% in the regular CPI and reflect far more realistic and accurate measures of medical and housing cost inflation.
As shown below, there is a stunning revelation here. It turns out that inflation, as measured by the “Flyover CPI” index, has risen at a 3.3% annual rate since the turn of the century. That is, the Fed’s hallowed targets are been drastically overshoot from above, while upwards of 80% of American households, which easily spend 65% of their budgets on the four horseman items, have experienced inflation at 2X the rate gummed about at the FOMC.

Needless to say, that causes the trend of nominal wages and incomes in flyover America to appear in a wholly different light when deflated by a more reasonable inflation measuring stick.
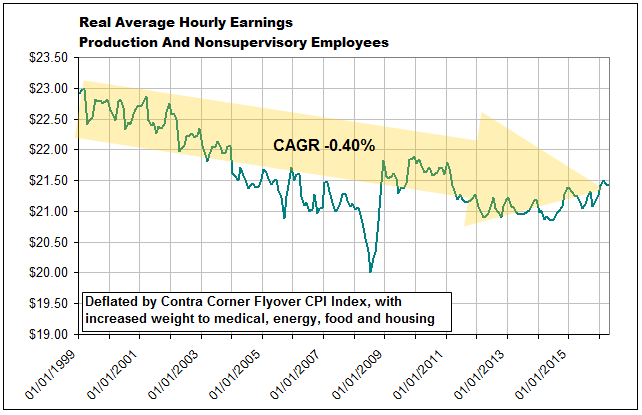
Here is one example. It shows that when reported hourly earnings are deflated by a more realistic inflation index than the deeply flawed CPI, the wages of flyover America have been declining for the entirety of this century, save for a few very short-lived spurts.
In fact, the average hourly wage rate in constant 2015 dollars is down nearly7% from its turn of the century level.
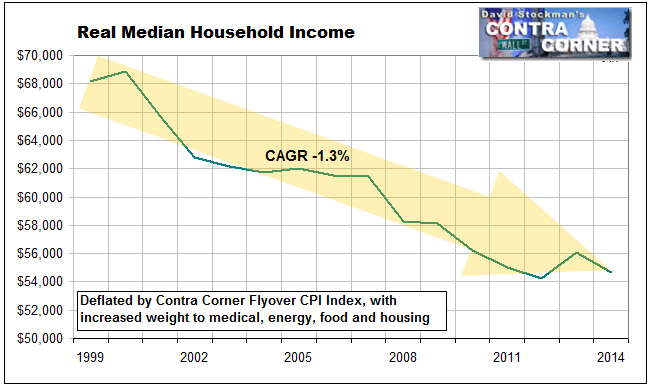
Moreover, owing to the declining labor force participation rate and the deteriorating mix of jobs available as measured by annual hours worked, the trend in real household money incomes (i.e. before in-kind government benefits) is even more troublesome.
As shown below, when deflated by the Flyover CPI, household incomes are now nearly 20% lower than there were when Bill Clinton was packing his bags to vacate the White House.
(To be continued in Part 2)
Reprinted with permission from David Stockman’s Contra Corner.
 Memorializing the Horrors of War