


Gold Market Update
February 22, 2016
This has been a momentous month for gold, with it finally breaking out of its long downtrend to commence a major bull market. Thus, it is amusing to see Goldman Sachs talking about it dropping back to $1000 again. Those timorously wondering whether they are right should stop and ask themselves whose interests are paramount to Goldman, the government, and Wall St, or the Little Guy trying to protect what’s left of his capital. Those still in doubt should read Goldman Capitulates.
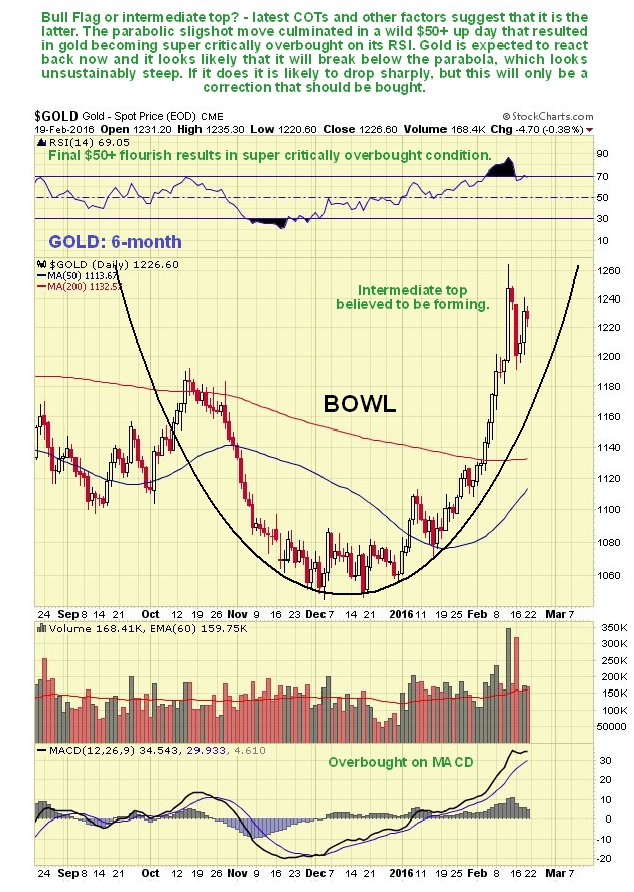
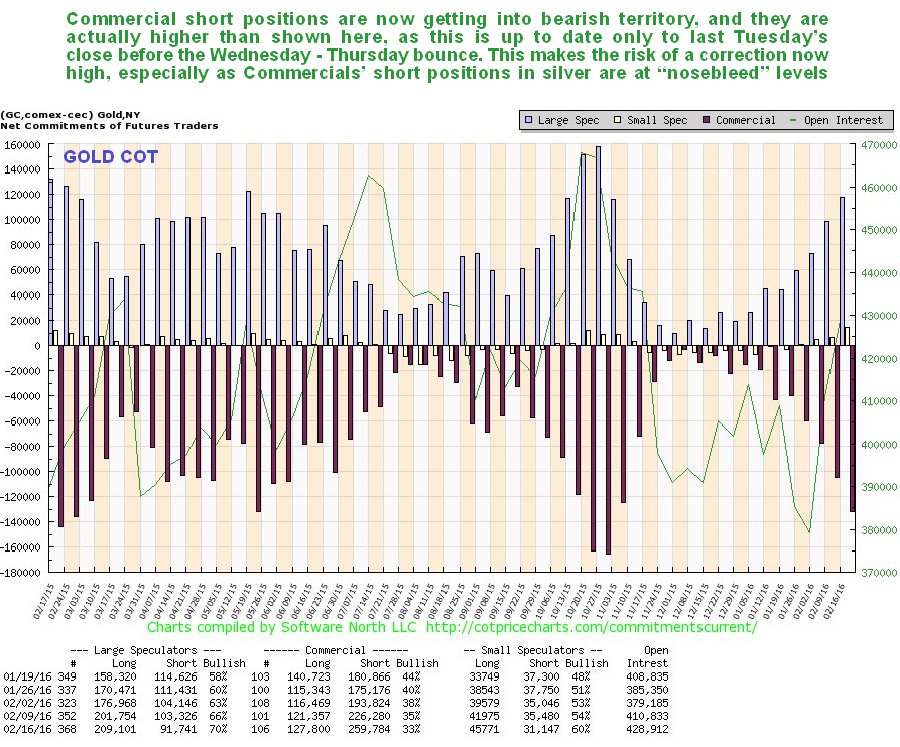
We have been wondering over the past week whether gold and silver have been starting to mark out bull Flags or whether they are instead at intermediate tops. That question is answered for us by the latest COTs which reveal that Commercial short positions have exploded in recent weeks, particularly in silver, where they are now at “nosebleed levels”. We therefore now expect a correction, which could be quite heavy – so Curb your Enthusiasm, people. When it happens don’t be fooled into thinking that the bear market is back on and Goldman is right. Instead, take the opportunity to back up the truck and load up on PM sectors investments, many of which have risen too far too
 The Big Short: Inside ...
Best Price: $1.49
Buy New $7.99
(as of 02:35 UTC - Details)
The Big Short: Inside ...
Best Price: $1.49
Buy New $7.99
(as of 02:35 UTC - Details)
 fast in recent weeks.
On its 6-month chart, we can see that gold’s breakout move involved it accelerating in a parabolic arc slingshot move, which resulted in burnout when it became extremely overbought. When we saw the gold price getting way ahead of its parabola, we liquidated our leveraged bull ETFs in the sector, only to look like jackasses 2 days later when gold spiked up by over $50. However, although we missed the cherry on the cake that this 1-day spike represented, the way things are shaping up that decision is not going to look like a bad one soon, especially given where we bought them at much lower levels late in November. We did not liquidate our gold stocks, however, and been letting them go at good prices in recent days in anticipation of a correction. Will gold correct not just to the parabola boundary, but break down from it? It looks like it will, given the latest COTs, and that is perhaps not a bad thing given how impossibly steep the parabola is becoming. When it does break down from the parabola the ensuing drop is likely to be sharp.
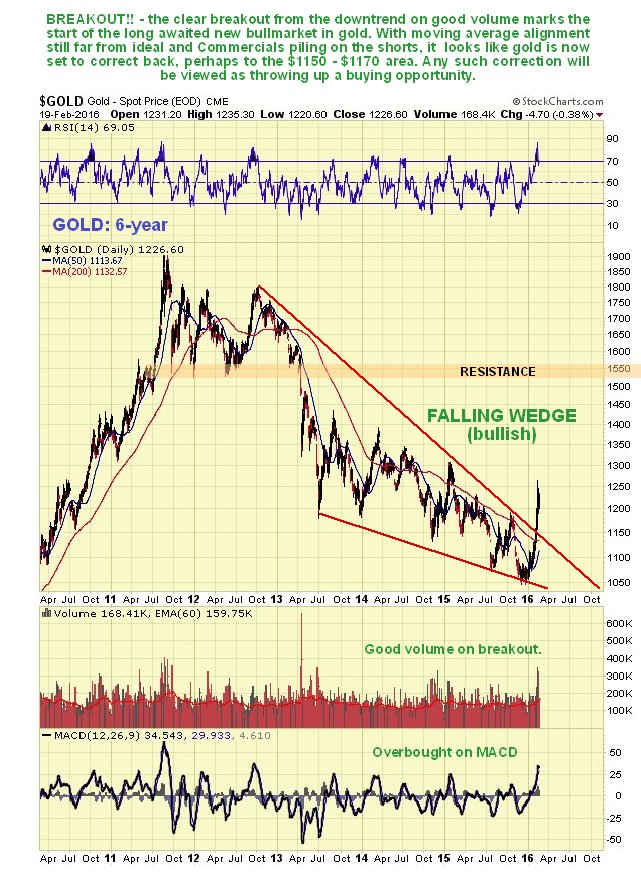
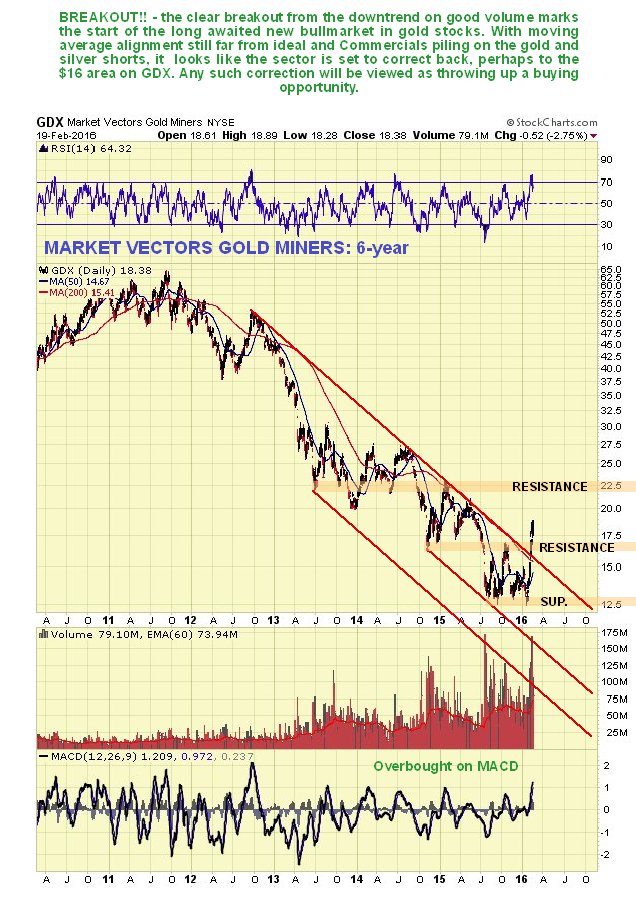
On the 6-year chart we see that the big picture is now strongly bullish, with the price having broken out of its long downtrend in force from 2012 on strong volume, so after the bull is done shaking as many new riders off his back as possible in coming weeks, the advance is likely to resume.
If you want fundamental reasons for a new bull market, you really don’t have to look far. Try aggressive NIRP (Negative Interest Rate Policy) for starters. The big banks have plans to seriously mine their customer’s accounts, and we are not talking about charging half a percent a year here, we are talking about 2 or 3 percent of your account money being siphoned off into their coffers every year for the privilege of you being able to hold an account with
 Money and Power: How G...
Best Price: $2.14
Buy New $9.60
(as of 08:50 UTC - Details)
them. Of course, any rational person knowing this was coming would withdraw their money and stuff it under a mattress or buy gold, so they are going to be prevented from doing so, by the introduction of the “cashless society”. The first steps towards this have just been announced with the proposed elimination of high-value bills like the 500 euro note and $100 bill, ostensibly to impede the activities of criminals and money launderers, which is, of course, a smokescreen to hide their true intent. Now you can see why gold suddenly looks so attractive – which would you rather do? – be a sheep and hold your money in a bank account and be fleeced to the tune of 2 or 3% a year, or own gold, where at least you are aren’t losing capital, apart from storage costs. It’s a no-brainer and with the cashless society and extreme NIRP (bank plunder) now appearing over the horizon, you can readily understand why gold is coming to life. That won’t stop a correction short-term, however, especially if the investing public gets suckered again by the latest stock rally.
Money and Power: How G...
Best Price: $2.14
Buy New $9.60
(as of 08:50 UTC - Details)
them. Of course, any rational person knowing this was coming would withdraw their money and stuff it under a mattress or buy gold, so they are going to be prevented from doing so, by the introduction of the “cashless society”. The first steps towards this have just been announced with the proposed elimination of high-value bills like the 500 euro note and $100 bill, ostensibly to impede the activities of criminals and money launderers, which is, of course, a smokescreen to hide their true intent. Now you can see why gold suddenly looks so attractive – which would you rather do? – be a sheep and hold your money in a bank account and be fleeced to the tune of 2 or 3% a year, or own gold, where at least you are aren’t losing capital, apart from storage costs. It’s a no-brainer and with the cashless society and extreme NIRP (bank plunder) now appearing over the horizon, you can readily understand why gold is coming to life. That won’t stop a correction short-term, however, especially if the investing public gets suckered again by the latest stock rally.
Long-term The Matrix will not tolerate escape routes like gold, so we can expect the ownership of gold to be outlawed and holdings subject to forfeiture, i.e. stolen by the government for nominal compensation, which is why Smart Money will be stashing gold in safe foreign locations before exchange controls are implemented in many Western societies, and organizing dual citizenships etc. The seizure of gold is still probably a long way off, however, and will occur after the cashless society is implemented, and in the meantime we are likely to witness a roaring bull market in both gold and silver.
Turning now to the all-important COTs, we see that Commercial short positions have ballooned in recent weeks to high level, and given that the latest reading, taken after the gold smackdown last Tuesday, does not incorporate the increases that must have accompanied the ensuing bounce back in gold on Wednesday and Thursday, we can presume that actual readings, for now, are higher than shown here. This is starting to look seriously bearish for the near-term, and the silver readings are much worse.
On the long-term Hedgers chart, which is a form of COT chart, we can see that positions are approaching the bearish side of the track, although overall, the level is not too seriously bearish, but it does portend a probable reaction soon.
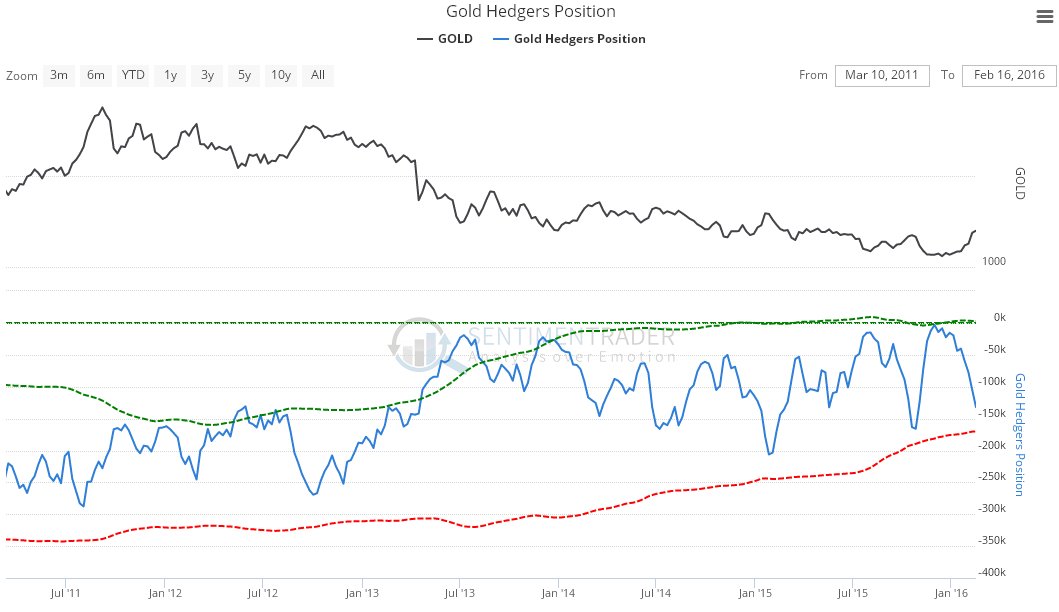
Chart courtesy of www.sentimentrader.com
The latest gold Optix, or Optimism chart, shows that optimism towards gold has soared – to its highest levels since 2012. This has happened quickly and is another warning that a correction is probably imminent.
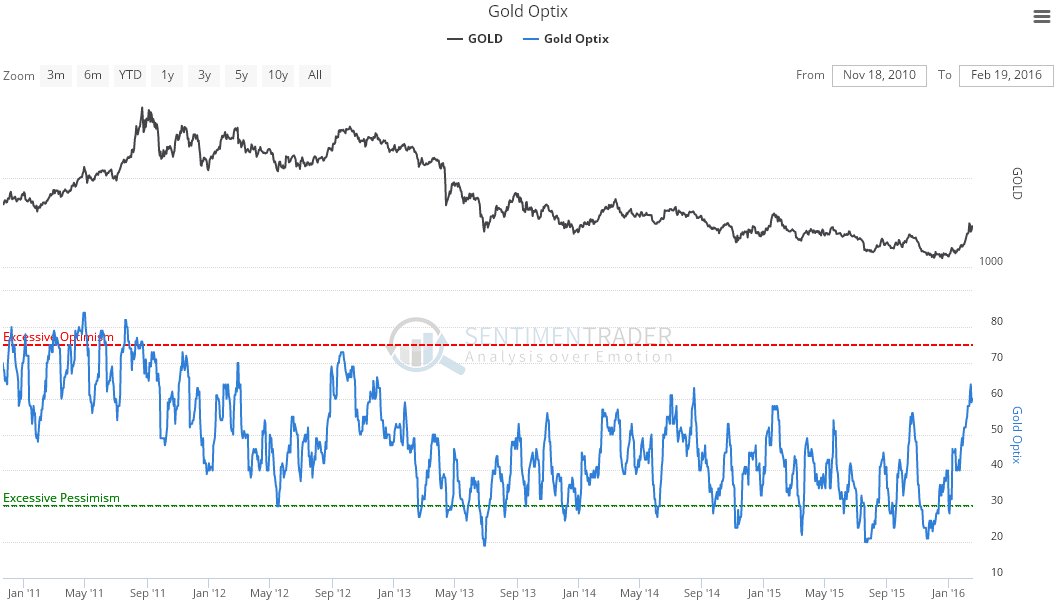
Chart courtesy of www.sentimentrader.com
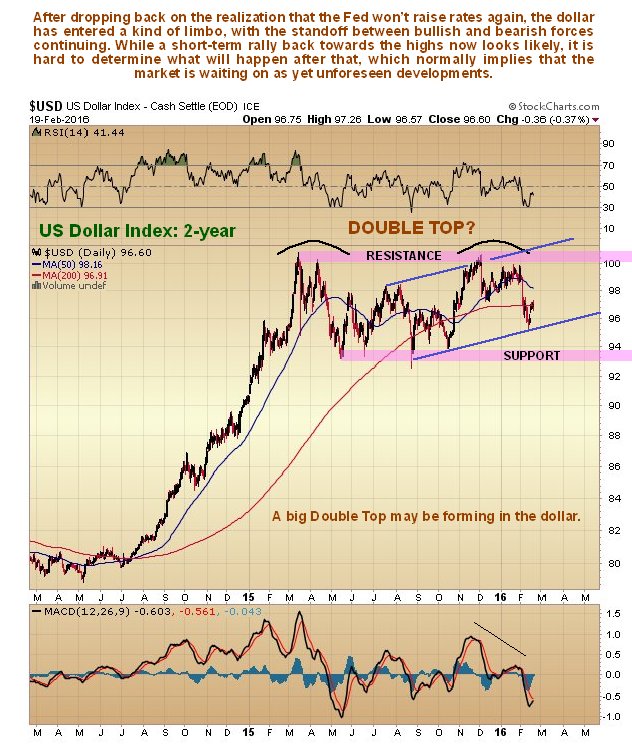
A correction in the Precious Metals is, of course, likely to coincide with a dollar rally. The dollar got slammed early in the month as we had expected on growing realization that the Fed’s rate rise was a “mistake” that will eventually be reversed in preparation for NIRP, as we can see on its 6-month chart below. In reality the Fed’s rate rise in December was a sop to the mugs who had believed their story about raising rates, so that they couldn’t turn round later and say “You lied to us for 18 months saying you were going to raise rates and didn’t.” Right now the dollar could rally in sympathy with the stockmarket for a while. The latest Hedgers chart, shown below, is in the middling ground and thus doesn’t provide much guidance, but it has been edging towards a bullish condition for many months, and so there is certainly room for a rally here.
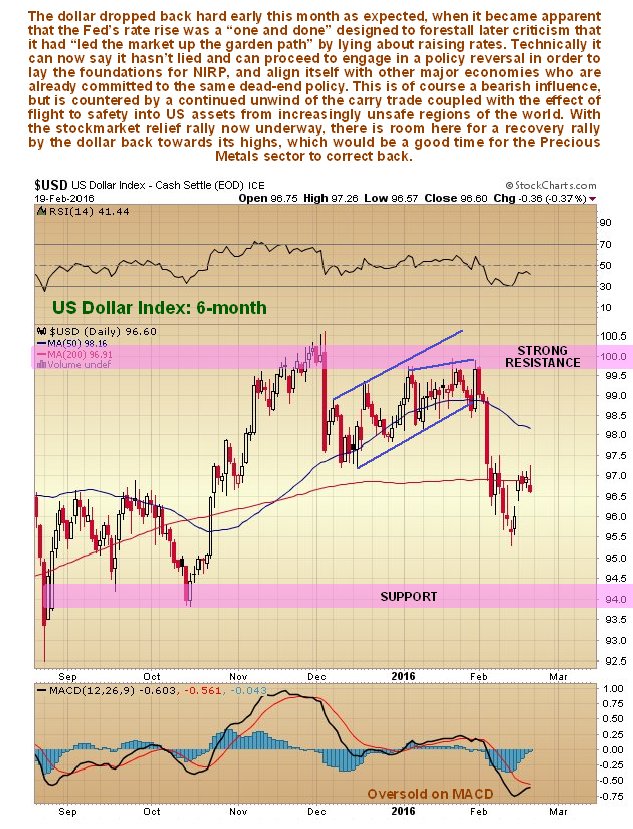
The 2-year chart for the dollar shows it trending sideways with a possible major top forming, with a temporary state of balance between bullish and bearish forces. On the bullish side, we have the danger of a continued unwinding of the carry trade coupled with a flight to safety into the dollar, on the bearish side the spreading realization that the Fed will join the pack and head in the direction of NIRP. A short-term rally towards the highs but not beyond them, in parallel with completion of the current stock market countertrend rally, will likely coincide with the expected correction in gold and silver.
Precious Metals stocks have definitely broken out of their downtrend, as we can see on the 6-year chart for GDX shown below. However, this looks like a “too far too fast” situation, especially as moving average alignment is still unfavorable, so a correction back is in order here, that would accord with the prospects for gold and silver in the light of their latest COTs.
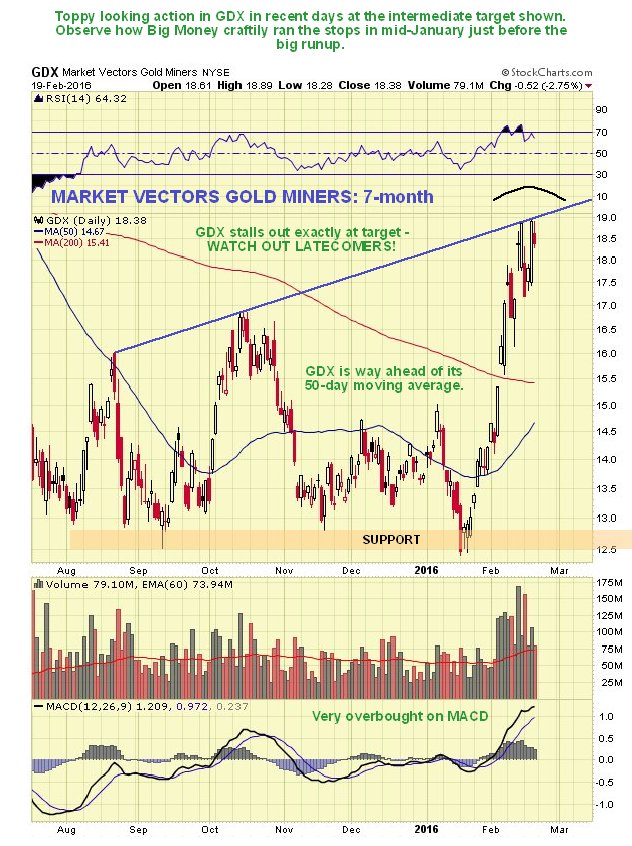
The 7-month chart for GDX is most interesting as it shows it rounding over having hit a target, so it is logical to expect it to correct back now. An amusing point to observe is how Big Money ran a lot of people out of their positions by triggering stops in mid-January – right before the big runup, a classic tactic.
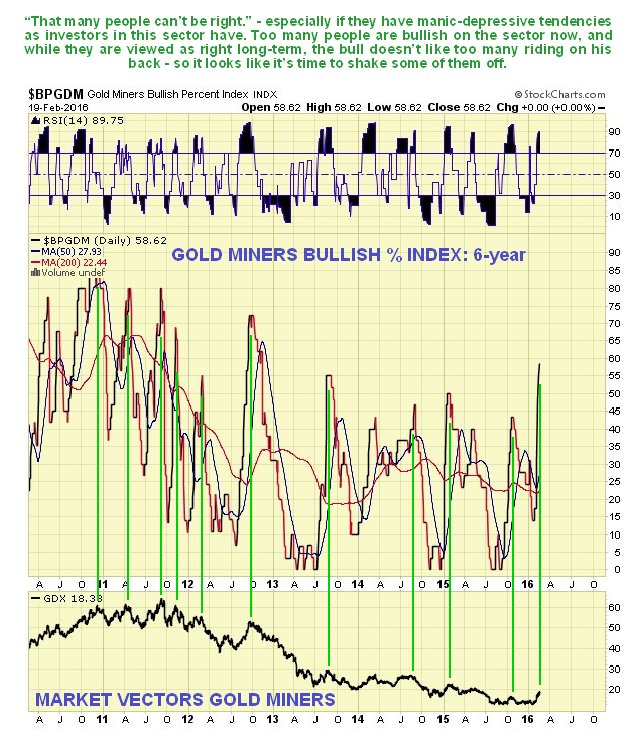
The latest Gold Miners Bullish % Index shows that the investing public is now highly confident towards the sector, with the highest level of confidence for over 3 years. What better time for new investors in the sector to learn the art of losing money in a bull market?
Originally Published February 21st, 2016.
Reprinted with permission from CliveMaund.com.
 Armed Self-Defense