


Birinyi’s S&P 3200 Call——Bull From A 30-Year Bull
August 6, 2015
When stock market guru Laszlo Birinyi told bubblevision today that S&P 3200 would be reached by 2017, his argument was essentially to keep on keeping on:
“What we’re really trying to tell people is stay with it, don’t let the bad news shake you out…There’s no reason we can’t keep on going,” he said.
That got me to thinking about when I first ran into Birinyi at Salomon Brothers way back in 1986. He was then a relatively underpaid numbers cruncher in the equity research department who was adept at making the bull case. Nigh onto 30 years later he has become a rich man crunching the numbers and still making the bull case.
Indeed, I don’t ever recall when he wasn’t making the case to be long equities, and as the chart below shows, you didn’t actually have to crunch the numbers to get there. Just riding the bull from 200 in January 1986 to today’s approximate 2100 on the S&P 500 index computes to a 8.4% CAGR and a 10% annual gain with dividends.
Even when you take the inflation out of it, this 30-year run is something close to awesome. But, alas, that’s my point. It’s too awesome.
In inflation-adjusted terms, the S&P 500 index rose by 6.2% per annum over the last three decades. That compares to just a 2.2% annual advance for real GDP, meaning that the market has risen nearly 3X faster than national output in real terms.
 Broken Markets: How Hi...
Best Price: $7.44
Buy New $24.98
(as of 05:40 UTC - Details)
Broken Markets: How Hi...
Best Price: $7.44
Buy New $24.98
(as of 05:40 UTC - Details)

You don’t have to be a math genius to realize that a few more decades of that kind of huge annual spread, and the stock market capitalization would be several hundred times larger than GDP.
Likewise, you don’t have to be a PhD in quantitative historical research to recognize that the last three decades are utterly unique. If you run the clock backwards by 30 years from the January 1986 starting point, for instance, you get a totally different picture.
Between the relative sunny Eisenhower times of 1956 through the eve of Greenspan’s ascension to the Fed, the S&P index rose by only 4.4X, not 10X. Even more significantly, when you strip out the inflation, the real index rose by 1% per year, not 6.2%.
Moreover, those dramatically less awesome stock market trends occurred during an era when the US economy was riding at its post-war high and clocked GDP growth of 3.5% per annum. That’s 60% more than the most recent equivalent period.
And while we are at it, let’s throw in the ultimate litmus test by comparing the real median family income growth between the two periods. During the 1956-1986 interval this basic measure of the main street standard of living rose from $36,000 to about $60,000 or 1.7% annually.
Since then, not so much. Between the days when Birinyi was peddling stock charts at Salomon Brothers and the present, the real median family income has risen by less than $4k or by 0.2% per year. You could call that flat-out stagnation for 30 years—-unless you like to quibble about rounding errors.
![]()
So the question recurs. If real GDP growth has decelerated so sharply and if family incomes have stagnated so unfortunately during the last 30 years why has the stock market been so relentlessly hyper-bullish?
Enter Alan Greenspan at the Fed in August 1987. At length, something else started growing like gangbusters.
To wit, the Fed balance sheet exploded by 22X during the last three decades. That amounts to 11.5% per annum in nominal terms; 9.2% in real terms; and four times the growth rate of real output.
![]()
 The Secret Club That R...
Best Price: $2.23
Buy New $16.87
(as of 09:55 UTC - Details)
The linkage between the Fed’s erupting balance sheet and the stock market’s 30-year bull run is not at all hard to fathom. Well, not unless you are a Keynesian economist and resolutely insist that balance sheets don’t matter; that it’s all about flow and “aggregate demand”.
The Secret Club That R...
Best Price: $2.23
Buy New $16.87
(as of 09:55 UTC - Details)
The linkage between the Fed’s erupting balance sheet and the stock market’s 30-year bull run is not at all hard to fathom. Well, not unless you are a Keynesian economist and resolutely insist that balance sheets don’t matter; that it’s all about flow and “aggregate demand”.
But that’s a ridiculous self-serving rationalization that Greenspan era central bankers blather about and Wall Street finds stupendously convenient. In fact, what happened was that the Fed’s relentless money printing caused a sweeping financialization of the US economy driven by a supernova of credit market debt.
During the approximate span of the modern bull run, credit market debt outstanding in the US—–household, business, financial and government—-has soared by $50 trillion. That compares to just a $13 trillion gain in GDP. Self-evidently, it doesn’t take a spread sheet to recognize that the nation’s leverage ratio soared in lock-step with the upward bounding stock market.
In fact, the 2.0X leverage ratio of 1986 was already significantly elevated from the historic 1.5X leverage ratio that had prevailed for a century prior to Nixon’s 1971 folly of destroying Bretton Woods at Camp David. But by the time of the financial crisis it had soared to 3.5X, and since then has retraced hardly at all.

In short, the last three decades have essentially witnessed a national LBO in which the productive capacity of the main street economy was hocked to a massive accretion of fiat credit. That is, the staggering growth of debt and leverage shown above did not result from some kind of rollicking outbreak of thrift and honest savings out of current income.
Indeed, the household savings rate has been plunging ever since 1971. So today’s mountain of debt was not funded from honest savings; it was conjured from thin air by the nation’s central bank and the banking and financial system into which its massive emissions of fiat credit were deposited.
![]()
This collapse of domestic savings, of course, raises the question of the economic dog which didn’t bark. That is to say, in a closed economy this kind of massive outbreak of fiat credit should have caused a nasty surge of consumer inflation.
But it didn’t because just as Greenspan was cranking up the printing presses, China’s Mr. Deng proclaimed that it was glorious to be rich, and that communist party power under the new regime of red capitalism would no longer issue from the barrel of a gun, as Mao had insisted. Now it would come from the end of a printing press.
Accordingly, Greenspan exported the massive dollar liabilities that accumulated on the Fed’s balance sheet, while China, the oil exporters and the Asian mercantilists including Japan mopped them up by printing staggering amounts of their own money.
 The Great Deformation:...
Best Price: $2.00
Buy New $9.95
(as of 09:55 UTC - Details)
The Great Deformation:...
Best Price: $2.00
Buy New $9.95
(as of 09:55 UTC - Details)
So doing, they inflated their own currencies, thereby suppressing their exchange rates and showering America and much of the DM world with artificially cheap goods. At the same time, a tidal wave of wage compression otherwise known as the “China price” flattened labor costs in the DM tradable goods industries and spilled over onto their suppliers, vendors and adjacent sectors.
Needless to say, it was this mutually linked monetary and credit tsunami that enabled the massive financialization of the US economy and the 30-year bull run which it fostered. With labor priced at close to zero and capital massively subsidized by the people printing press of China, exports from the Mr. Deng’s gleaming new export factors virtually swamped the planet.
In a world of honest money and credit funded from real savers, not central bank printing presses, of course, there is not a remote chance that China’s exports could have risen by 40X in less than three decades. That was 17% annually and is a rate of gain that cannot be sustained without systemic falsification of exchange rates and financial prices by the central banks.
In a true free market, the China export machine would have run out of capital to build cheap factories and would have suffered soaring exchange rate increases long before the historical aberration depicted in the chart below reached its current towering height.
![]()
In the short run, of course, these vast deformations of credit, trade and capital flows all amounted to a giant economic swap. The vast rice paddies of Asia were awakened and brought into the global trading system and monetary economy. So doing, they absorbed the Fed’s monetary inflation and permitted main street American to goose its living standard with debt financed consumption, while not inflating the cost of goods and labor.
At the same time, America’s $50 trillion uptake of new debt provided the financial fuel that funded a massive increase in stock market speculation and corporate financial engineering in the form of LBOs, stock buybacks and
 Den of Thieves
Best Price: $1.49
Buy New $12.03
(as of 02:35 UTC - Details)
incessant M&A deals. In a round about but unmistakable manner, the East Asian central bank printing presses recycled the Fed’s monetary inflation back into domestic financial asset inflation.
Den of Thieves
Best Price: $1.49
Buy New $12.03
(as of 02:35 UTC - Details)
incessant M&A deals. In a round about but unmistakable manner, the East Asian central bank printing presses recycled the Fed’s monetary inflation back into domestic financial asset inflation.
That is the true reason for the stock market’s 30 year bull run. There has been a huge increased in the capitalization rate of national income or the implied PE ratio of the stock market. But that did not reflect a permanent improvement after 1986 in the productive efficiency or profitability of the US economy.
In fact, measured productivity growth has been cut in half. And were real GDP not overstated owing to ridiculously low price deflators, the true rate of productivity gain since the late 1980s would have registered at a mere fraction of its pre-1986 trends.
No, the fact that the US stock market capitalization rose from 60% of GDP upon Greenspan’s ascension to 200% today is purely a monetary effect. In practical terms, it reflects a giant ratchet upwards of leveraged speculation in the financial system.
At the end of the day, that’s what ZIRP, QE and the implicit Greenspan/Bernanke/Yellen “put” do. They fuel a cycle of debt funded speculation that drives asset prices ever higher, which, in turn, become the collateral for an even bigger credit-funded bid for financial assets.
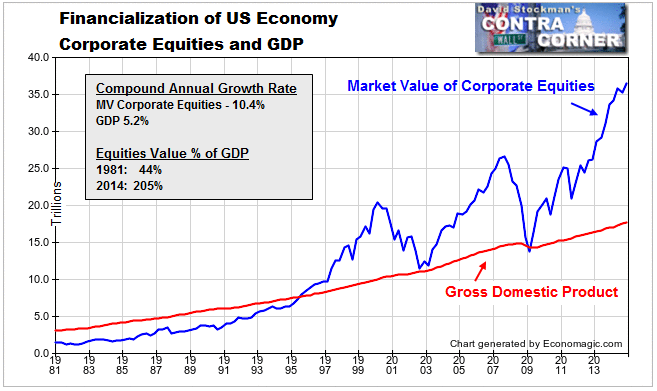
Corporate Equities and GDP – Click to enlarge
In sum, at the time that Birinyi was peddling his Salomon stock research reports back in 1986, the financial sector—defined here as the market value of equities plus credit market debt outstanding—- was about $12 billion. Today it is $93 trillion.
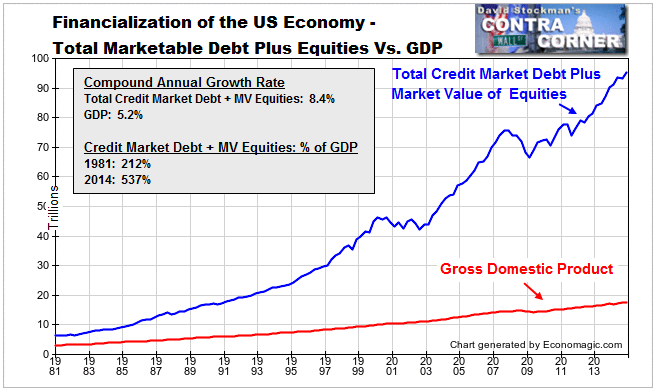
Total Marketable Securities and GDP – Click to enlarge
You might call the above the mother of all bubbles. And you might also ask why that bubble can be expected to “keep on keeping on” when at last something epochal has changed. Namely, the world’s convoy of central banks have run up against the limits of money printing.
 Crash of the Titans: G...
Best Price: $1.96
Buy New $9.30
(as of 06:05 UTC - Details)
Crash of the Titans: G...
Best Price: $1.96
Buy New $9.30
(as of 06:05 UTC - Details)
In the US, the Keynesian apparatchiks who run the Fed have decided to quit on the basis of doctrine and their thoroughly misguided belief that the US economy is “fixed”. But once they embark upon “normalization” later this fall, there will be no turning back. A reversal into a new round of massive balance sheet expansion would amount to a repudiation of the last 20-years of Fed policy, thereby triggering a collapse of confidence in the casino and a selling panic of epic scale.
Likewise, China’s printing press is being forced into neutral as well. Having turned a few hundred billion of domestic credit at the time of Mr. Deng’s early 1990s proclamations into $28 trillion today, the overlords of red capitalism sit atop the most lunatic pyramid of credit and speculation in human history. Capital is now fleeing the swaying towers of the Chinese Ponzi—–upwards of $800 billion in the last year alone.
Accordingly, China’s central bank is being forced into an about face. After nearly three decades buying dollar liabilities with newly printed RMB to keep its exchange rate from rising, it is now in the position of selling dollar liabilities and shrinking the RMB supply in order to keep the exchange rate from plunging into an abyss.
This means that the principle central banks of the world do not have the firepower to keep inflating the global financial bubble. Indeed, they are helpless in the face of a worldwide deflationary wave that is the product of their own falsification of asset markets and systematic financial repression.
In a word, Birinyi’s 3200 call is bull because the central bank enabled 30-year bull run is over. At last.
Reprinted with permission from David Stockman’s Contra Corner.
 The Slaughter of Babes