


Job Growth Surges Again, Fueled by the Fed's Huge Monetary Overhang
March 14, 2023
The Bureau of Labor Statistic (BLS) released new jobs data on Friday. According to the report, seasonally adjusted total nonfarm jobs rose 311,000 jobs (seasonally adjusted) in February, which was nearly 100,000 jobs above expectations. The unemployment rate rose slightly from 3.4 percent to 3.6 percent (month over month) but this partly reflected a rising labor participation rate which rose to 62.5 percent, the highest estimate since March 2020.
These numbers point to continued resilience in the job market, even if the employment numbers are not nearly as good as the Biden Administration has attempted to claim. The total number of employed persons, for example, is up less than one percent over two years. Nonetheless, this report suggests we have yet to see widespread layoffs extend beyond the growing layoff totals in the tech sector.
The current relative strength in the job market partly reflects the ongoing monetary overhang from years of breakneck growth in money-supply inflation. It is apparent that the $6 trillion in money that was newly created since 2020 is still very much a factor in the present economy. Even with a historic collapse in the money-supply growth since last fall, the economy appears to still be in only the very early phases of an economic bust that is to be expected in the wake of a monetary slowdown.
In spite of the “good” news of continued job growth, however, markets fell on Friday. This is partly due to the fact that in the current policy environment, good news is bad news because Wall Street interprets strong jobs numbers as an indicator the Federal Reserve will continue raising interest rates. Wall Street, the real estate industry, and the investor class in general want the opposite: a return to an environment of very low interest rates and easy money. (Markets also fell because of the failure of the massive Silicon Valley Bank on Friday morning.)
Once we take a closer look at the employment numbers and other economic indicators, however, we find plenty of indicators that recession is indeed on the way within the next year. Weak economic data in manufacturing, real wage growth, and home prices all point toward overall economic decline.
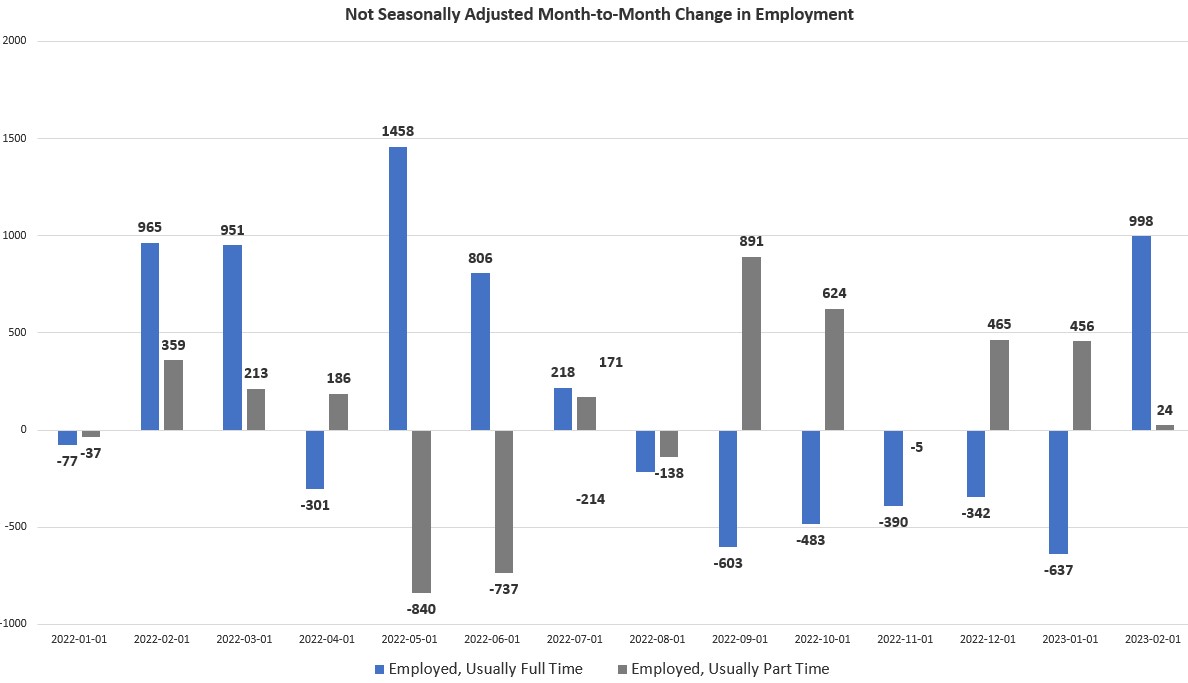
Weakness in Full-Time Employment
Month-over-month job growth was generally positive. February brought an end to a six-month trend in employment in which growth in full-time employment was consistently weaker than growth in part-time work. In February, full-time employment grew (month over month) by 998,000 jobs (not seasonally adjusted) while part-time employment grew by only 24,000 jobs:
When comparing year-over year growth, however, the numbers suggest ongoing economic turbulence. Full-time work outpaced part-time work by a remarkably small 151,000 jobs. In most months, this number ranges from one to four million. When this gap between year-over-year growth in part-time and full-time growth approaches zero, that usually indicates that a recession is coming. We saw it happen in 1981, 1990, 2001, 2008, 2020. Now it’s happened again in 2023:

Job Openings from Other Sources
Another sign of trouble in the jobs economy are recent declines in job openings in private-sector jobs listing sites. While federal survey data suggests job openings remain near 2022’s multi-decade highs, data from job-posting site Indeed suggests new openings have fallen off considerably since early January, with the index dropping to the lowest post reported since July 2021.

This is especially concerning because federal survey data continues to worsen in terms of the response rate to surveys. Over the past three years, the Job Opening and Labor Turnover Survey (JOLTS), which provides job openings estimates, has seen its response rate fall from nearly 60 percent down to 31 percent. It is unclear whether this survey tells us much about the broader economy anymore.
Falling Real Wages
According to February’s employment data, it looks like February will mark the 23rd month in a row during which wage growth has failed to keep up with price inflation. In February, average hourly wages incresed (year over year, not seasonally adjusted) by 4.57 percent. Yet, the Cleveland Fed’s Nowcast estimate of price inflation for February suggests price inflation in February was 6.2 percent. This the Nowcast number proves to be close to the official CPI print next week, that means wage growth was negative in real terms, yet again, in February:

Home Prices
Naturally, as real wages have fallen, the ability to keep up with home-price growth has also been impacted. Last Friday, residential real estate brokerage firm Redfin reported a decline in home prices for the first time since 2012. The most recent Case-Shiller home price data shown continues softening in home prices, dropping to 5.8 percent in December. Meanwhile, the number of new single-family homes sold fell 19 percent in January, year over year. During the same period, housing starts were down 21 percent.
These trends are part of the reason why Fannie Mae’s economists now expect a recession in 2023.
To find other troubling trends, we might point to the fact credit card debt has climbed to new all-time highs over the past year while the personal savings rate remains well below the post-2009 average.
Bad economic news also arrived on Friday in the form of the collapse of Silicon Valley Bank which ended in regulators forcing the bank to shut down. SVB’s collapse is the first since the financial crisis of 2008, and is the second-largest ever. It is still unknown how this will affect the larger economy.
For now, though, February’s jobs report would seem to back up Fed Chaiman Jerome Powell’s claim that overall, the full effects of a falling money supply have yet to be fully felt. Even with rapidly slowing dollar flows, many sectors of the economy remain flush with cash. Moreover, consumer spending is receiving a sizable boost this year with the largest increase in Social Security’s cost of living adjustment since 1981. These factors are all inflationary and, for now, continue to feed labor demand. Job data always looks fine until it doesn’t however, and increases in job losses and unemployment often begin only after a recession is in full swing. For example, the unemployment rate did not exceed five percent during the Great Recession until March 2008. That was 4 months after the recession officially began.
February’s ongoing job growth shows just how long it can take for long periods of monetary inflation to unwind. Inevitably, years of malinvestment, bubbles, and price inflation eventually take their toll and lead to economic bust. The timing, however, is always impossible to predict.
Note: The views expressed on Mises.org are not necessarily those of the Mises Institute.

 Biden’s Genius Detente Has Cost America the Old Ballgame