


When a COVID infection wave hit the most and least vaccinated states in 2022, the most vaccinated state had the higher COVID case rates and the higher relative death peaks. Whoops!
According to US News & World Report, Wyoming is the least vaccinated state (52.8%) and Rhode Island is the most vaccinated state.
So just for fun, I thought I’d see how these states fared when there was a huge COVID infection outbreak at the start of 2022 that affected both these states.
It turned out that the least vaccinated state had the lower rise in all-cause mortality (1.25 vs. 1.42) vs. avg mortality for the year.
In other words, vaccination appeared to increase all-cause mortality when COVID hit.
However, it might be the case that Rhode Island simply was “hit harder” by the COVID wave with twice as many COVID infections per capita. Or was Rhode Island hit harder because more people were vaccinated and thus more susceptible to infection which is what the Cleveland Clinic study showed very clearly?
By looking at a younger age group, we see a 3X disparity between the two states. The least vaccinated state came out on top.
We have further, and more conclusive, confirmation from an extensive study done by Josh Stirling. There is simply no way for anyone to explain those results which looked at every county in the US.
The bottom line: higher vaccination —> higher deaths for all age groups. That’s why 15-year-olds with heart attacks are now the new normal when they were non-existent before the vaccines rolled out.
COVID waves are when the CDC would expect the most vaccinated states to do the best compared to the average death rate for the year. So we’d expect a smaller rise in deaths during a COVID infection wave compared to the deaths over the year.
The biggest COVID death peak is at the start of 2022.
So the method is pretty simple: compare the worst four weeks at the start of 2022 with the average death rate for the year in that state. The winner should have the lowest ratio.
![]()
I used the CDC database of weekly deaths by age and state and the visualization tool on the CDC website.
Worst consecutive 4 weeks are weeks 1-4: (52+66+40+73)/4=57.75 average per week.
Worst 4 week avg/annual avg = 57/40.23=1.42
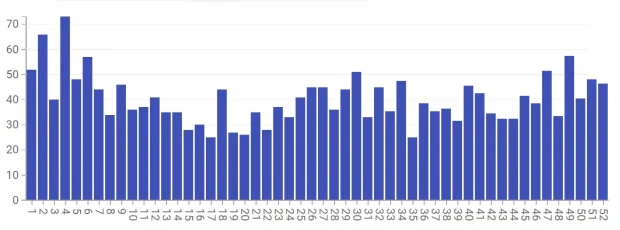
Rhode Island 2022 avg 40.23
Worst consecutive 4 weeks are weeks 1-4: (30+26+27+29)/4=28
Worst 4 week avg/annual avg = 28/22.48=1.25
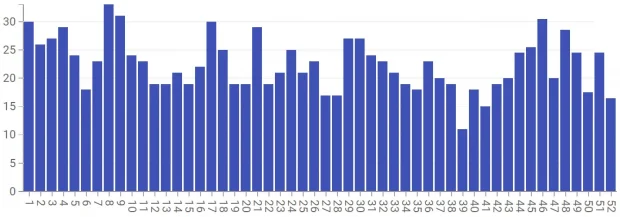
Wyoming 2022 Avg 22.48
Maybe we just picked the “wrong” age group.
Let’s try the next age group down which is 45-64 over the same “deadly” period.
Weeks 1-4 avg for Wyoming=(24+23+22+16)/4=21.25
Average for 2022=19.25
Ratio: 21.25/19.25= 1.1
Weeks 1-4 avg for Rhode Island: (50+46+44+31)/4=42.75
Avg for 2022=32.6
Ratio: 42.75/32.6=1.31
Again, Wyoming had the smaller spike among that age group.

