


Steve Kirsch asked a very good question: how come the COVID statistics of Santa Clara county show the effectiveness of COVID vaccines far exceeding that reported anywhere else in the world?

The answer, of course, is that their charts are fake. Santa Clara County undercounts unvaccinated people, and their Covid case rate dashboard even contradicts their own vaccination dashboard!
What’s going on?
Santa Clara County’s wastewater COVID measurements show another wave of Covid that exceeds last winter and summer.

How come this highly vaccinated county, suffering from the fifth wave of Covid infections that is setting wastewater records, shows graphs illustrating the alleged extreme effectiveness of vaccines? Can we believe them?
Look at the chart of case rates by vaccination status:
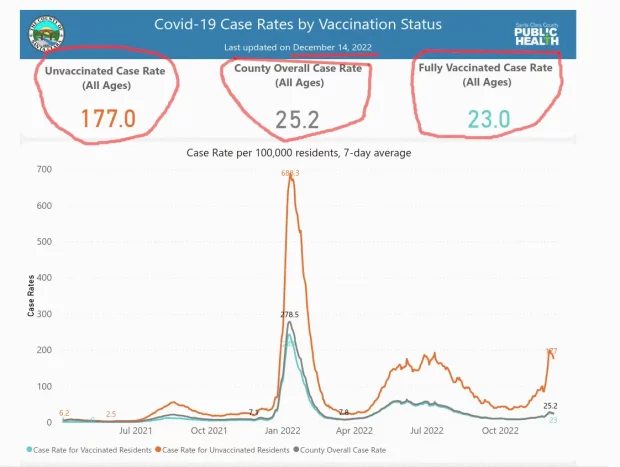
The case rate among the unvaccinated is 177, while the case rate among the vaccinated is 23 per 100,000. This implies vaccine effectiveness at preventing infection, as
Vaccine Effectiveness = 1-23/177 = 87%.
Santa Clara County says that this December of 2022, vaccines are 87% effective at preventing infection. Could this be possibly true? Is there a sleight of hand involved?
People who are partially vaccinated, meaning they only received one dose of a two-dose vaccine or who are not yet 14 days after their final dose, are not included in either category.
That’s a common dishonest trick not to count illnesses that happen in two weeks after receiving a booster. The one-dose people were mostly vaccine-injured and, therefore, unable to continue vaccinating. All these people should be considered “vaccinated.” Excluding them is cheating.
It gets worse from here, however.

