


No, Climate Change Did Not Cause Hurricane Ian
October 3, 2022
It’s been pretty obvious for a while now that today’s “news” media is not about facts, but consists mainly of spin, narrative and propaganda. Yet if there was ever any doubt, just note the constant calamity-howling of Washington politicians, onsite reporters and TV screen chryrons with respect to Hurricane Ian.
In the midst of the usual things hurricanes do – overturned boats, flooded streets, storm battered houses – you also get literally cosmic pronouncements: The worst storm in Florida’s history, a 500-year event, a disastrous foretaste of things to come. And all because of Climate Change.
Leading the pack, of course, was Joe Biden himself. After the announcement of 12 unfortunate deaths due to the storm, he wanted to be damn sure you connected the dots to the Climate Crisis. Fresh from looking for a Congresswoman who was actually dead, he claimed –
……this could be the deadliest hurricane in Florida history.
Not exactly. Florida’s deadliest hurricane on record was the 1928 Okeechobee storm, which killed more than 2,500 in the state. And as to the alleged plague of fossil fuels and internal combustion engine cars, there were less than 10 million vehicles on the roads worldwide back then compared to 1.4 billion today.
Then again, why should mere orders of magnitude get in the way of the narrative? Just assert the “Climate Change causes bad weather” mantra over and over and be done with it.
Still, this stubborn truth remains: Hurricanes are not getting bigger, more frequent and more destructive, and the evidence for that is overwhelming.
In fact, on a global basis there has been essentially no change in the frequency of these storms during the last 50 years – a span in which mankind has been allegedly wrecking the climate owing to soaring fossil fuel use and the resulting CO2 emissions.
Consider the three charts below. During the last 50 years, global fossil fuel consumption has soared by 2.5X from 55,000 terawatt hours in 1970 to 135,000 at present and CO2 emissions have more than doubled.
During the same period, by contrast, the annual number of hurricanes (lower line) has diminished slightly, while the number of total tropical storms (upper line) has fluctuated around a constant long-term trend.
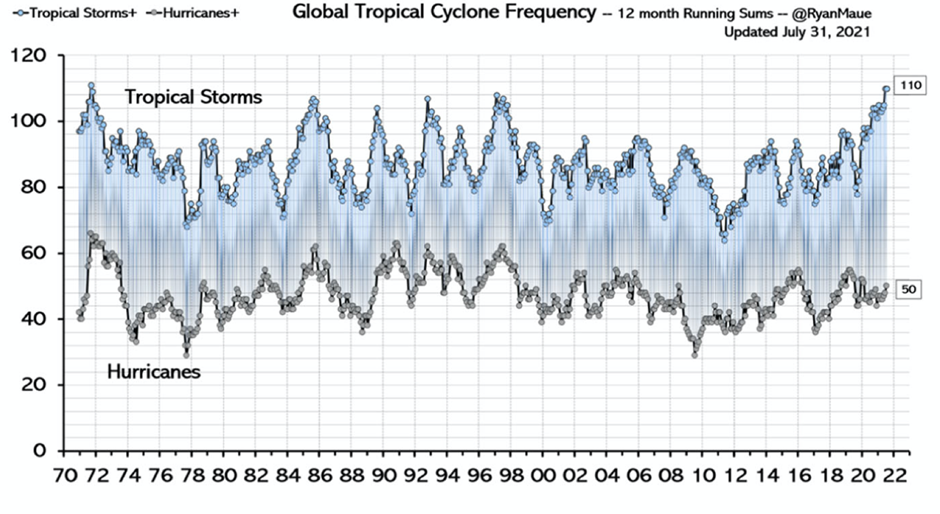
Moreover, when it comes to the really “bad” storm mantra dominating today’s news, the fact is that the number of “major hurricanes” (bottom line below) with wind-speeds over 96 knots during the past 12 months was very close to a 42-year low!
Likewise, the 42-year record of all hurricanes with wind-speeds of greater than 64 knots have been trending down as well.
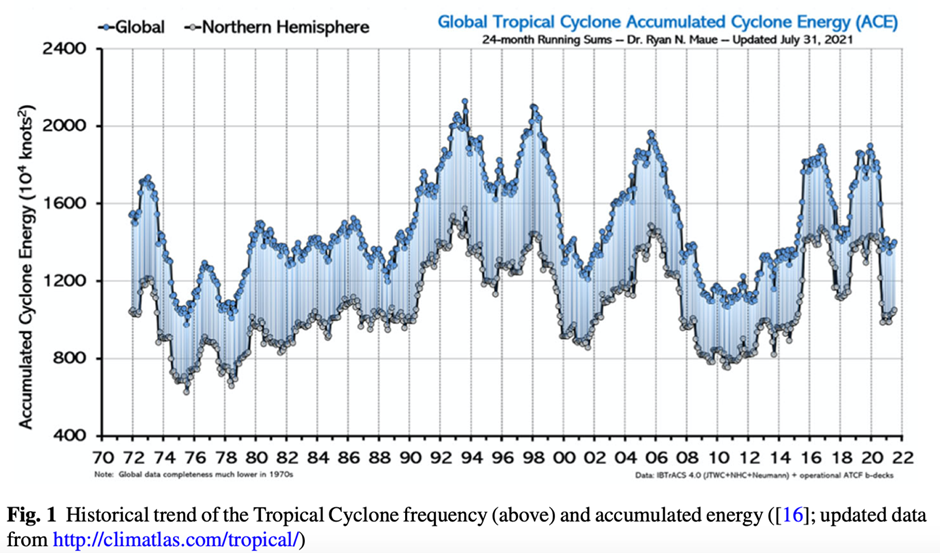
But the clincher is something called the ACE, which is an index of total cyclone energy worldwide. This index was first developed by the renown hurricane expert and Colorado State University professor, William Gray.
It uses a calculation of a tropical cyclone’s maximum sustained winds every six hours. The latter is then multiplied by itself to get the index value and accumulated for all storms for all regions to get a global index value for each year as shown below. This chart covers the past 170 years, where the red bars are the annual figure and the blue line represents the seven-year rolling average.
As we have explained before, your editor has an especial regard for the expertise of William Gray. Back in our private equity days we invested in a Property-Cat company, which was in the super-hazardous business of insuring against the extreme layers of damage caused by very bad hurricanes and earthquakes. So setting the premiums correctly was no trifling business and its was the analytics, long-term data bases and current year forecasts of Professor Gray upon which our underwriters crucially depended.
That is to say, hundreds of billions of insurance cover was then and still is being written with ACE as a crucial input. Yet if you examine the 7-year rolling average (blue line) in the chart, it is evident that ACE was as high or higher in the 1950s and 1960s as it is today, and that the same was true of the late 1930s and the 1880-1900 periods.

The ACE chart below, which dials in on the last 50-years, is especially telling. Neither on a northern hemisphere (lower line) or global basis is there a hint of a long-term worsening trend coterminous with the above displayed increase in fossil fuel use and emissions.
On the other hand, it is also evident that there are shorter-term cyclical variations based on the long-standing weather mechanics of the oceans and the atmosphere. From highs to lows, in fact, the variation of the 24-month running sum of accumulated cyclone energy is nearly 100%.
And these cyclical fluctuations in ACE get to the actual truth of the matter. That is, Atlantic hurricane activity, for example, is generated by atmospheric and ocean temperature conditions in the the eastern Atlantic and North Africa. Those forces, in turn, are heavily influenced by the presence of an El Niño or La Niña in the Pacific Ocean.
El Niño events increase the wind shear over the Atlantic, producing a less-favorable environment for hurricane formation and decreasing tropical storm activity in the Atlantic basin. Conversely, La Niña causes an increase in hurricane activity due to a decrease in wind shear.
These Pacific Ocean events, of course, have never been correlated with the low level of natural global warming now underway.
The number and strength of Atlantic hurricanes may also undergo a longer 50–70 year cycle. This is known as the Atlantic Multidecadal Oscillation, but, again, these cycles are unrelated to global warming trends since 1850.
In fact, scientists have reconstructed Atlantic major hurricane activity back to the early eighteenth century (@1700) and found five periods averaging 3–5 major hurricanes per year and lasting 40–60 years each; and six other periods averaging 1.5–2.5 major hurricanes per year and lasting 10–20 years each. These periods are associated with a decadal oscillation related to solar irradiance, which is responsible for enhancing/dampening the number of major hurricanes by 1–2 per year, and clearly not a product of AGW.
Moreover, like in all else the very long term records of storm activity also rule out AGW because there was none of the latter for most of the time during the last 3,000 years, for instance. Yet according to a proxy record for that period from a coastal lake on Cape Cod, hurricane activity has increased significantly during the last 500-1,000 years compared to earlier periods – long before industrialization and fossil fuel burning could have been the cause.
In short, there is no reason to believe that these well understood precursor conditions and longer-term trends have been impacted by the modest increase in average global temperatures since the LIA (Little Ice Age) ended in 1850.
Nevertheless, the MSM just keeps repeating the lies. For instance, this claim:
The Category 4 hurricane, which is one of the most powerful to ever make landfall in Florida at 150mph, is also set to be one of the costliest storms in US history.
Well, no, not even close. But to understand how out-to-lunch these MSM claims are you need to consider two factors:
- the physical facts of prior hurricanes such as maximum wind-speeds and landfall atmospheric pressures; and
- the state of economic development in Florida and other impacted areas at the time of the storm – that is, the property and economic values in harms’ way when the storm tore through impacted regions.
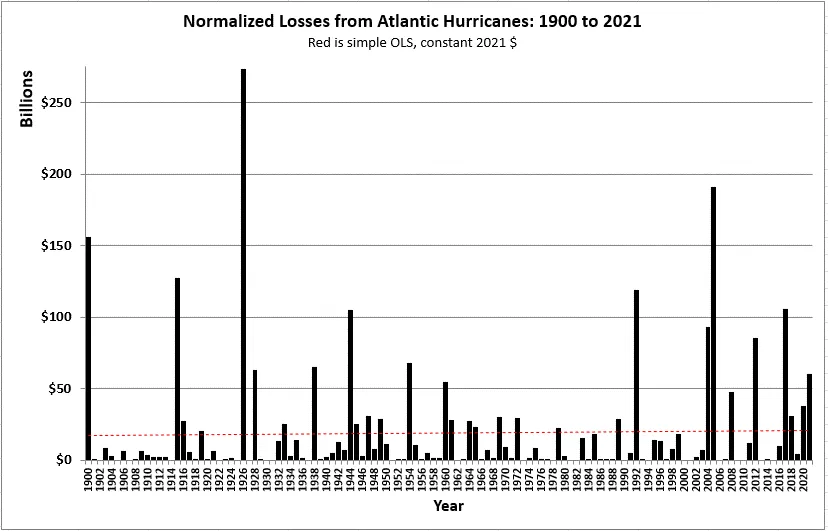
Obviously, the Great Miami Hurricane of 1926 did not do remotely as much economic damage (even as adjusted for inflation) as current period storms because at the time Miami was still, well, the proverbial swampland.
Fortunately, analysts have translated the physical characteristics of storms over the last century to present day economic damage equivalents by modeling today’s level of urban development and property values.
The table below shows all Category 4-5 hurricanes to make landfall in Florida on record (since 1851), including their maximum sustained wind and minimum sea level pressure. At it maximum, Ian was a Category 4 hurricane with max winds of 155 mph and pressure of 937 mb.
It is plain as day from the table that when it comes to big storms, Ian isn’t anything special. The average wind-speed of these 14 category 4&5 storms was 145 mph and the average landfall pressure was 933 Mb – or within a hair of the numbers now being cited for Ian.
Moreover, when it comes to the whose is bigger contest, the table makes clear that based on these two key physical measures the 1935 Labor Day storm, Hurricane Andrew (1992) and Hurricane Michael (2018) were more powerful. That is to say, notwithstanding this week’s MSM insistence, Hurricane Ian is not remotely in a league of its own among all large Florida storms in the past century.

And that gets us to the “economic damage” dimension because that’s the heart of all the Climate Change caterwauling. Supposedly, we have to stop using fossil fuels or the resulting massive and rising economic damage will bring the end of economic prosperity as we know it.
Once again, however, not a chance. While definitive figures are not yet in, Chuck Watson, a disaster modeler at Enki Research, has now estimated that the storm could cost the US up to $67 billion in economic damages. Besides damaging homes and infrastructure, the hurricane also ruined orange farms in the largest producing state, causing orange juice prices to surge.
But the OJ spike is the tip-off. The path of Ian was mainly through lightly developed and populated central Florida, not the big cities of the east cost from Miami north or even Tampa on the west coast. Accordingly, Hurricane Ian doesn’t even rank in the big time when it comes to economic damage based on 2022 levels of economic development.
In fact, it would be #9 right below Hurricane Harvey and just a small fraction of the giant storms of 1900 and 1926.
The table below show damage estimates for individual storms, were they to make landfall in 2022, updated from this paper.

As one analyst noted,
You can see that while a few storms of the past decade make it into the top 25 of loss events, there are many storms from the distant past which would cause much more damage, were they to occur today. That means your and my lived experience cannot capture the realities of hurricane disasters. We don’t need climate change to understand that much greater hurricane disasters are possible, just a sense of history.
So what we can say is calm down. Like so often is the case, the MSM is simply peddling a load of bull regarding bad weather owing to Climate Change.
No. The bad weather has been with us long before the modern era of fossil-fuel based prosperity. There is no need to sacrifice its manifold blessings.
PEAK TRUMP, IMPENDING CRISES, ESSENTIAL INFO & ACTION
Reprinted with permission from David Stockman’s Contra Corner.
 Don’t Bring the World to an End!