


The Coming Black Swan
November 20, 2021
The massive leveraging of US nonfinancial businesses over the last several decades is utterly incompatible with the stock market cap rising from 62% to 204% of GDP.
The US business economy is now carrying 13X more leverage than it did 50 years ago.
Nonfinancial Business Debt as % of Gross Production, 1972–2020
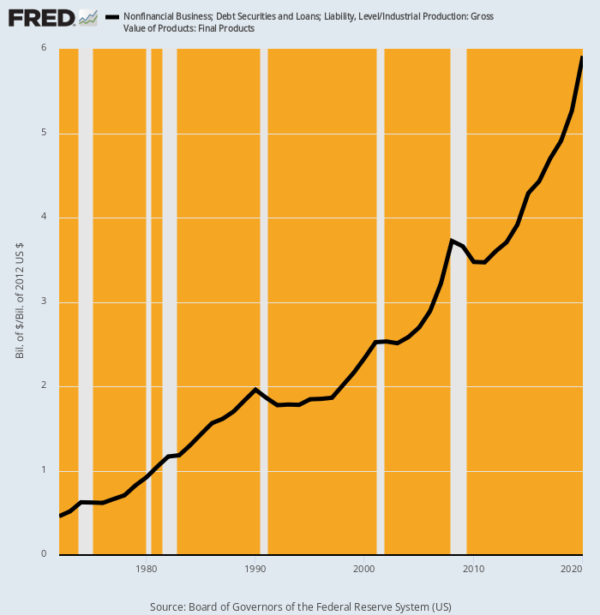
Here is what has actually happened to business balance sheets:
- Back in 1972, total business debt outstanding of $634 billion amounted to just 46% of the gross value of US industrial production, which was $1.38 trillion.
- By 2007, business debt had soared to $10.1 trillion and stood at 321% of the gross industrial production of $3.15 trillion.
- By 2020 the debt figure had risen to $17.7 trillion even as the value of industrial production had remained pinned to the flat line. That is to say, at the end of last year’s Fed-fueled borrowing spree in the US business economy, the leverage ratio clocked in at an off-the-charts 592%.
With this high leverage, growth and profits-generation will become steadily weaker over time. This means that the stock market capitalization rate of the national income should be falling, not heading skyward as described above.
Indeed, since March 2009 equity investors have come to realize that any correction would lead to a bounce and a new upward run. At the beginning it took a long time before positive trading emotions and Pavlovian rewards emerged, but as the bull run accelerated, the rewards came faster and faster.
Until very recently.
Previously, all the dips — even micro-dips — were almost instantaneously bought by the herd of traders and homegamers driven by Pavlovian reflexes, thereby reinforcing the power of positive feedback loops. But as Zero Hedge observed, this loop may finally be reaching its sell-by date:
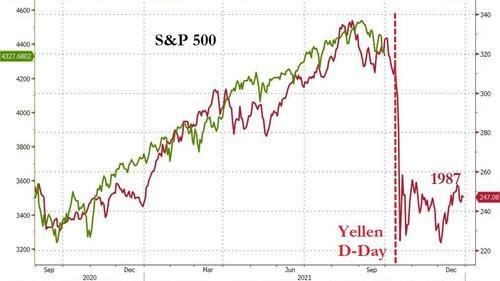
Something’s different this time.
For the first time since the collapse in March 2020, the S&P 500 has failed to rebound back to new highs after testing its key uptrend technical levels.

Source: Bloomberg
The larger problem is the risk that an external shock — a black swan — will break the entire chain of dip-buying and options-based speculation and eventually trigger a put-buying stampede, especially among the homegamers who have never experienced a down market.
Their Reddit gurus will tell them they can ride out the storm and safely hang on to their FANGMAN, Teslas, and meme stocks by buying “protection” via puts on their portfolios. That, of course, will trigger more delta hedging among options dealers, more ETF liquidations, and more temptations for the fast money to engage in open shorting of a market suspended on a sky-hook.
As one analyst pointed out, the 1987 crash is a good illustration of the risks associated with out-of-control positive feedback. In the chart below, he laid the recent S&P 500 run against the final 12-months preceding the 30% stock market meltdown in October 1987.
We have no idea whether the high has yet been reached or what “shock” might cause the present coiled spring to lunge into reverse. But with each passing episode of sharp selloffs and only partial BTFD (buy the freaking dip) rebounds, the odds of a meltdown reversal continue to rise.
Reprinted with permission from International Man.
Copyright © International Man
 Fauci Finally Admits Vaccines Don’t Protect Against Serious Covid or Death