


Did Biden Really Win California?
July 6, 2021
The November 3, 2020, Presidential election data from California should set off alarm bells.
Election data generated by the natural voting process will closely match Benford’s Law predictions. (Benford’s Law, or the rule of leading digits, is used as an indicator of fraud in numerical data.) Of course, there can be exceptions, but Benford’s Law points to areas to investigate.
Benford’s Law predicts that for real, natural data, the frequency of leading digits (1 through 9) will occur at or near the following percentages of the transactions or tallies. Deviations from these predicted percentages should be investigated.

Here are the official presidential totals for California, as released by Dr. Shirley N. Weber, Secretary of State (also released by Alex Padilla, Secretary of State through January 28, 2021):

The difference in votes tallied is 5,104,121 in favor of Biden. The average precinct size is 1073 votes.
Biden had a nearly 2-1 official victory margin over Trump across the state. Here are detailed statistics for the statewide election, again, from Dr. Weber.
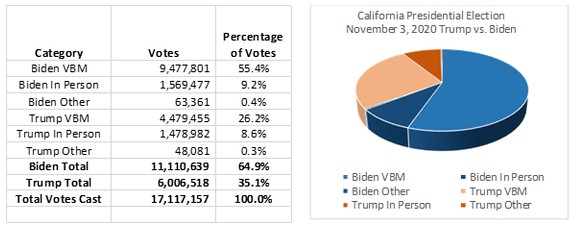
VBM is Votes by Mail.
Now, let’s apply Benford’s Law to identify possible fraud. Here is the statewide Benford chart, displaying the frequency of precinct tallies’ leading digits for Biden and Trump, compared to Benford targets. The official data have separate tallies for votes cast In-Person and by Vote-by-Mail for each precinct. Given this, there are roughly twice the tallies than the number of active precincts in the state.

This chart looks almost normal. The Benford targets (i.e., the expected leading digit percentages) are shown by gray vertical bars. Trump’s precinct leading digit percentages are shown by the orange line; Biden’s are the blue line. If we look closely, however, the Biden line is low in leading digits for 2, 3 and 4, and high in leading digits for 1, 6, 7, 8, and 9.
The Chi-Squared test is a statistical tool that measures the correlation of two curves (two sets of sequential data) and provides a numerical value for the correlation, with zero percent indicating little or no correlation, and 100% indicating high correlation. The Chi-Squared test is calculated and provided to show the candidates’ precinct tally data’s closeness to the Benford target curve.
Now let’s isolate the data for sources of fraud. Here is the equivalent state-wide chart for In-Person votes only.
Copyright © American Thinker
 Hey, Doctor – Leave Those Kids Alone!