


Epic Gold Market To Follow Epic Stock Market Bubble
January 29, 2021
Most investors are more interested in getting richer than preserving wealth. This is why they will never exit the stock market. As the Dow up 39x in the last 50 years this has been the right strategy. Only since 2009, the Dow is up 5x! So clearly a Win-Win position!
But as Jeremy Grantham recently said, stocks are in an “epic bubble”. Still most investors ignore this since greed dominates their emotions. If stocks are up 3,800% since 1971, there is no reason why it shouldn’t continue.
STOCKS or GOLD
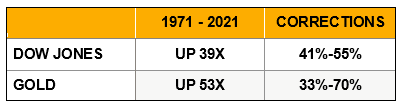
During the last 50 years we have seen 5 vicious corrections in the Dow of between 41% and 55%.
But even with these corrections, the Dow is today 39x higher than in 1971.
There is another relatively small but important investment asset which represents only 0.5% of global financial assets. That asset is up 53x since 1971.
But it hasn’t been an easy journey for this asset either. There were 3 major corrections in half a century between 33% and 70%.
I am of course talking about gold.
If dividends are excluded gold has outperformed the Dow. With dividends reinvested, the Dow has outperformed gold by 3x. Leasing or lending the gold would have reduced the difference somewhat.
 Nearly Natural 15in. P...
Check Amazon for Pricing.
Nearly Natural 15in. P...
Check Amazon for Pricing.
 But the principal reason to hold gold is that it is nobody else’s liability and therefore physical gold should never be leased as it defeats the purpose of holding it for wealth preservation.
We must also remember that a stock index doesn’t tell the truth. Unsuccessful or failed companies are continuously taken out of the index and the most successful companies added. Therefore an index gives a much rosier picture than what really happened.
THE DOW WILL LOSE 97% IN REAL TERMS
All of the above is history. Even though gold has yielded an excellent return, it is what happens to the Dow/Gold ratio in the future that determines if investors should stay with stocks or hold gold.
The chart below of the Dow-Gold ratio gives us the answer.
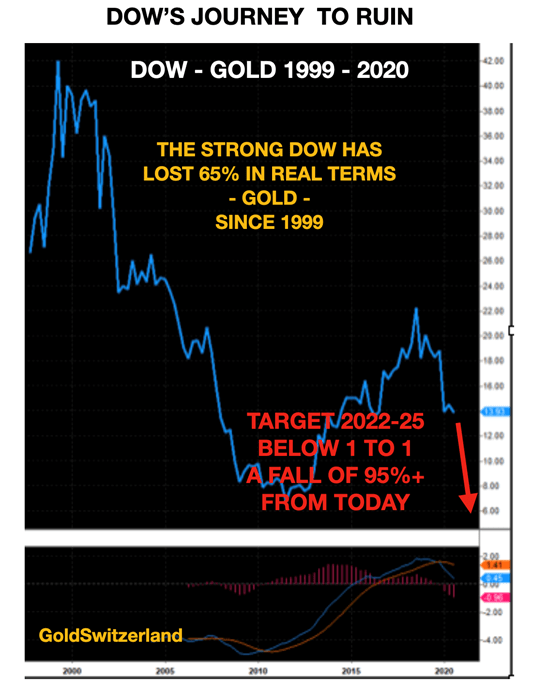 +
+Gold bottomed at $250 in 1999 as the ratio peaked at 45. The ratio subsequently fell to 5 in 2011 and corrected from there to 22.5 in 2018.
 Lotus Fun Silver Marqu...
Check Amazon for Pricing.
Since 2018, the Dow/Gold downtrend has resumed. The indicator at the bottom of the chart is the quarterly MACD which is a very important indication of the long term trend. The MACD turned down in 2019 for the first time since the 1999 top. This is a very strong sign that Dow/Gold has now resumed the long term downtrend.
Lotus Fun Silver Marqu...
Check Amazon for Pricing.
Since 2018, the Dow/Gold downtrend has resumed. The indicator at the bottom of the chart is the quarterly MACD which is a very important indication of the long term trend. The MACD turned down in 2019 for the first time since the 1999 top. This is a very strong sign that Dow/Gold has now resumed the long term downtrend.
If we then look at the long term picture of the Dow/Gold ratio, it gives us a very good idea of where we are heading.
The initial target is a ratio of 1 to 1 as in 1980 when the Dow was 850 and gold $850.
That would involve a 94% fall from here.
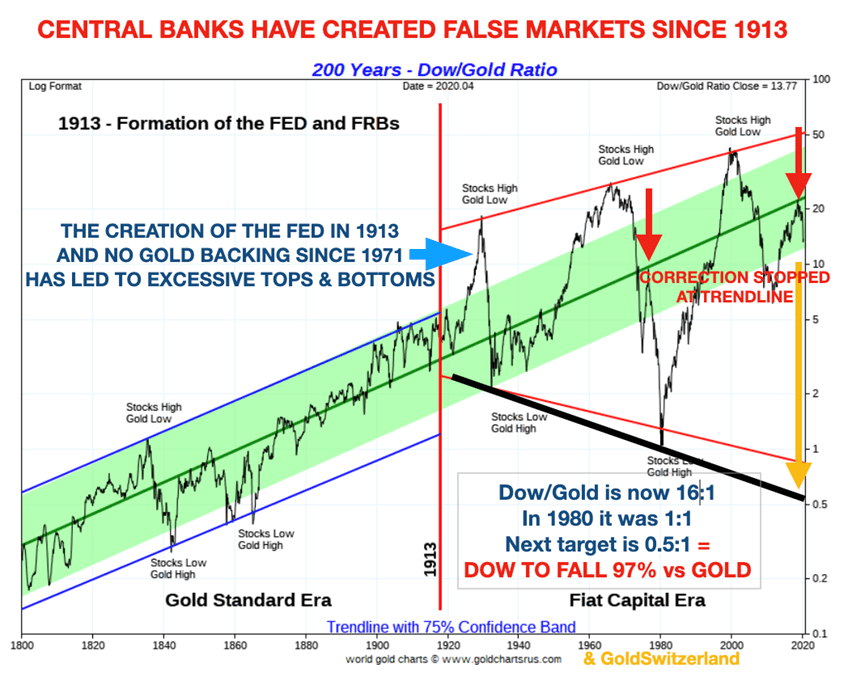
But the ratio is very likely to reach the long term downtrend line of 0.5 to 1. This would be a 97% fall from now.
So the Dow falling by at least 97% against gold by 2025 seems very likely.
Since these kind of moves very often overshoot, we could easily see a Dow/Gold ratio of 0.2 to 1 which would mean a 99% fall of the ratio from today.
For confirmation of major overshoots of the green Confidence Band, see extremes in 1929, 1966, 1980 and 1999,
What this would mean in the nominal price for gold or the Dow is totally irrelevant.
Copyright © Matterhorn Asset Management AG - GoldSwitzerland
 Why the Utes Opposed Biden’s Plans To Limit Oil Drilling