


Jobless Thursday - How the Donald Is Making America Poor Again
July 25, 2020
Maybe it is time to don our tinfoil hat. Here’s the flat-out lie the WSJ reported this morning in response to the weekly unemployment claims release. It sure did make you think that the jobs picture is improving by the week:
The number of people receiving benefits through regular state programs, which cover the majority of workers, decreased by 1.1 million to 16.2 million for the week ended July 11. The decline extends the recent trend, with the number receiving benefits the lowest reading since the week ended April 11.
Just to make sure you grasped the good news, the WSJ added this chart for good measure:

Actually, there was no improvement at all this week!
And what remains is the greatest labor market disaster in history. As Wolf Richter observed in his excellent post on the heels of the DOL (Department of Labor) report:
 Peak Trump: The Undrai...
Best Price: $12.72
Buy New $43.07
(as of 11:40 UTC - Details)
Peak Trump: The Undrai...
Best Price: $12.72
Buy New $43.07
(as of 11:40 UTC - Details)

If you read this morning or heard on the radio that 16.2 million people were claiming unemployment insurance – the “continued claims” – and you thought that there were only 16.2 million people who claimed unemployment benefits, you fell victim to lazy misreporting in the media, by reporters or bots that didn’t read the Labor Department’s press release beyond the second paragraph.
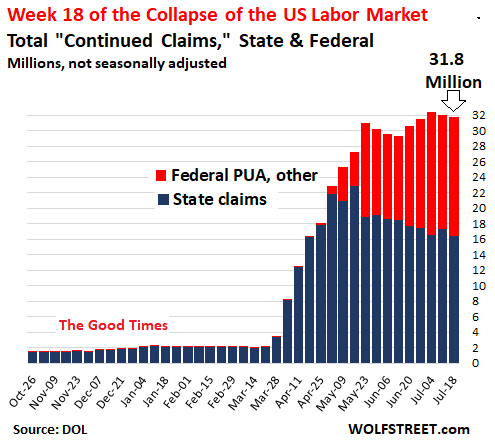
Not even close, of course. The true number is 31.8 million, just a tad below the peak two weeks ago, and implying that fully 20% of the US labor force is unemployed.
It’s all in the report, but apparently the Wall Street Journal reporter – we are speaking to you Eric Morath – was either too lazy to read below the second paragraph, or too dimwitted to see that even as the blue bars (state UI beneficiaries) have been falling slightly per the WSJ’s misleading chart above, the red bars (the Federal PUA and PEUC beneficiaries) have been rising rapidly and are still at record levels.
So when you look at the total (and correct) unemployment picture, you see that the labor market has been treading water for nine weeks.
Moreover, when you cross-check these DOL data with its June report on the total civilian labor force, you get an answer that the stock market cheerleaders who claim to be the business press wouldn’t approach by a country mile. To wit, the civilian labor force as of June was 159.9 million and the number of workers currently at home collecting the dole is 31.8 million.
Whether by the old math or the new, that computes to an unemployment rate of 19.9% and it’s a figure that has not been seen since the dark days of the 1930s.
It’s hard to believe, of course, that reporters are this lazy, but you can’t gainsay the obvious. As Wolf Richter further noted,
The issue is that the claims under federal programs are new, established by the CARES Act, and the Labor Department just inserts them further down in the press release, and then it provides a total of state and federal claims further down – the 31.8 million – instead of putting the total in the first line of the first paragraph so that even lazy reporters or lazily programmed bots, who’ve for years reported only the first two paragraphs, can see it.
 2018 - Present (n1oz G...
Check Amazon for Pricing.
That’s right. They are not really even hiding the data, but the business press has been house-trained for so long to report only good news and positive deltas that not one in a thousand reporters has ever even seen Wolf Richter’s charts (which he has been publishing weekly since May) because they obviously repudiate the V-shaped recovery narrative.
2018 - Present (n1oz G...
Check Amazon for Pricing.
That’s right. They are not really even hiding the data, but the business press has been house-trained for so long to report only good news and positive deltas that not one in a thousand reporters has ever even seen Wolf Richter’s charts (which he has been publishing weekly since May) because they obviously repudiate the V-shaped recovery narrative.
For want of doubt, however, here is Wolf Richter’s explanation of what’s in the red portion of the bars above. It both underscores the absolute disaster caused by Dr. Fauci’s Lockdown Nation and also explains why Washington politicians are now sweating bullets as they argue over re-upping Everything Bailout 4.0.
Self-evidently, without the $75 billion per month that Uncle Sam is firehosing into the smoldering ruins of the labor market via these special Federal UI programs, there would already be riots in the streets that would make the recent Minneapolis altercations looks like small potatoes:
Unemployment insurance under federal programs.
Pandemic Unemployment Assistance (PUA): 13.18 million continued claims. PUA covers contract workers, the self-employed, and others – the “gig workers”: During the week, 974,999 new claims were added by 48 states.
This means initial claims under state and federal programs combined this week totaled 2.35 million (1.37 million initial state claims plus 974,999 initial PUA claims), a huge number of people newly out of work!
The total number of people claiming benefits under the PUA program declined to 13.18 million, from 14.28 million last week, as more workers that had been receiving PUA benefits were dropped from the rolls, likely because they’d started working again.
Pandemic Emergency Unemployment Compensation (PEUC): 940,113 continued claims, about flat with the prior week. PEUC covers people who don’t qualify for other programs.
These continued claims under the PUA and PEUC programs, plus workers under programs for federal employees and newly discharged veterans, plus workers covered by all remaining programs are represented by the red columns in the first chart above.
So the most generous thing you can say without going full-retard tin foil hat is that the DOL is employing misdirection in order that some impertinent member of the financial press doesn’t shout out loud the obvious. Namely, how do you square the above flat-lined total UI claims of more than 30 million per week since mid-May, with the monthly unemployment data showing a 5.3 million reduction of unemployed workers between April and June.
Better still, if there were really only 17.75 million unemployed workers in all of the USA as of June, who, pray tell, are the additional 14 million Americans that are drawing unemployment checks week after week?
Total US Unemployed Workers Per BLS Monthly Report

Needless to say, the BLS employment data isn’t worth the paper it’s printed on at turning points and during wholly extraordinary conditions like the present.
That’s because contrary to the breathless reporting by the MSM on monthly Jobs Friday, these figures are not a real world count of anything; they are the product of infinitely complex and jerrybuilt models, imputations and guesstimates that are continuously revised for five years. This means that the initial releases often bear only a faint relationship to the final numbers – which are issued long after anyone in today’s 24/7 world of ultra-recency bias is paying any attention at all.
 The Last Gold Rushu202...
Buy New $28.00
(as of 04:04 UTC - Details)
The Last Gold Rushu202...
Buy New $28.00
(as of 04:04 UTC - Details)
So let’s get the story straight. Donald Trump never generated anything which looked like MAGA, but he did unleash the most destructive attack by the state on capitalist prosperity in all of American history. Thirty-two million workers on the dole – victims of Lockdown Nation – is all the proof you need.
Of course, the economic disaster represented by those figures is being thinly disguised by the tsunami of free stuff that was puked-out by Washington’s panicked politicians in late March and April. Yet what they actually have to show for it is an explosion of transfer payments like never before seen, and which cannot possibly be sustained.
The chart below shows the UI portion of total government transfer payments since the turn of the century. At the dark bottom of the Great Recession, the annualized payment rate peaked at $161 billion in January 2010.
By contrast, the UI payment rate (annualized) in May 2020 was $1.28 trillion or 8X higher. That, in effect, is the great air cushion that is keeping the household spending machine afloat; and is the reason the GOP Senate caucus is twisting itself into knots attempting to find agreement on the next Everything Bailout.
As we showed yesterday, a corporal’s guard led by Senator Rand Paul is finally putting its foot down because the truth of the chart below is not hard to discern. On the margin, Uncle Sam and the states are now borrowing at a rate of $107 billion per month to pump make-pretend spending power into the American economy without a dime of output to show for it.
Once upon a time, we called that the delusion of free lunch economics.
It still is.

Then again, the above chart is only the tip of the transfer payment iceberg. In fact, during the month of May total government transfer payments to American households weighed-in at an $8.73 trillion annual rate.
That’s right. Notwithstanding the explosion of UI payments shown above, they only accounted for 15% of total transfer payments during May, which also included social security, Medicare/Medicaid, Food Stamps, cash assistance and a medley of lesser welfare programs.
 2020 1 oz Gold America...
Check Amazon for Pricing.
2020 1 oz Gold America...
Check Amazon for Pricing.
Back in the day, Ronald Reagan arrived in the Imperial City determined to shrink the ballooning Welfare State. At the time (December 1980), total government transfer payments amounted to $293 billion at an annual rate, and accounted for an already significant 20.3% of wage and salary income, which weighed-in a $1.44 trillion.
Needless to say, the Gipper barely laid a glove on the Welfare State monster, albeit not for lack of desire or effort; and his efforts did blunt the growth rate for a period of time.
But history will surely show that the clueless braggart who now occupies the Oval Office – and who signed into law the vertical explosion of the red line in the chart below – supplied the coup d’ grace.
During the 40 years since 1980, wage and salary incomes have grown by 6.0X while total Welfare State outlays under the Donald’s watch in May 2020 clocked in at the aforementioned $8.73 trillion. That’s 18.0X higher.
That is, transfer payments are now equal to 60.0% of wage and salary income or three times the ratio which prevailed in 1980 after the big spending years of FDR, Truman, Lyndon Johnson, and Jimmy Carter.
We have always been at a loss to understand why anyone thought the Donald was a “conservative”.
In the last four months, in fact, he has presided over the greatest outburst of socialist regimentation and Welfare State free stuff in the history of the nation.
The irony is that his foolishness in unleashing Lockdown Nation and the Everything Bailouts in response to a manageable superflu called the Covid is making America Broke Again.
That’s exactly what real conservatives have been warning about for the last 90 years.

PEAK TRUMP, IMPENDING CRISES, ESSENTIAL INFO & ACTION
Reprinted with permission from David Stockman’s Contra Corner.
 Demolishing the Lincoln Myth