


A Wobbling Stock Market
August 20, 2019
A third period of heightened volatility shouldn’t surprise us.
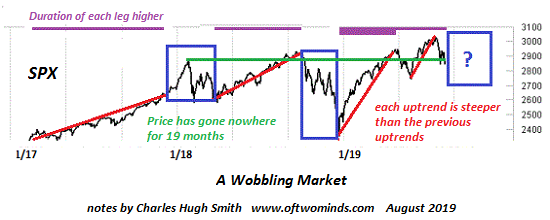
Consider this chart of the SPX (S&P 500) over the past two years: take a look at the relative steepness of each of the red lines (rallies), the duration of each rally (purple lines), the blue boxes (volatile spots of bother) and the green line (market has gone nowhere for 19 months as every rally to new highs drops back to or below the high of January 2018).
As the saying goes, a market topping is not an event, it’s a process. There are a handful of historically useful characteristics of topping markets:
 Pathfinding our Destin...
Best Price: $9.95
Buy New $12.00
(as of 03:30 UTC - Details)
Pathfinding our Destin...
Best Price: $9.95
Buy New $12.00
(as of 03:30 UTC - Details)

1. Declining volume / liquidity
2. Increasing volatility–major swings up and down that increase in amplitude and frequency
3. Inability to break decisively above previous resistance (i.e. make sustainable new highs in a stairstep that moves higher).
We see all these elements in the S&P 500 over the past few years. A healthy, stable advance in 2017 led to a manic blow-off top that crashed in February of 2018, setting off a period of high volatility.
This set up another stable advance that was shorter than the previous advance, and also steeper. This led to the multi-month period of instability that concluded in a panic crash in December 2018.
 On Self-Defense