


The 'Deficits Don't Matter' Folly
June 15, 2019
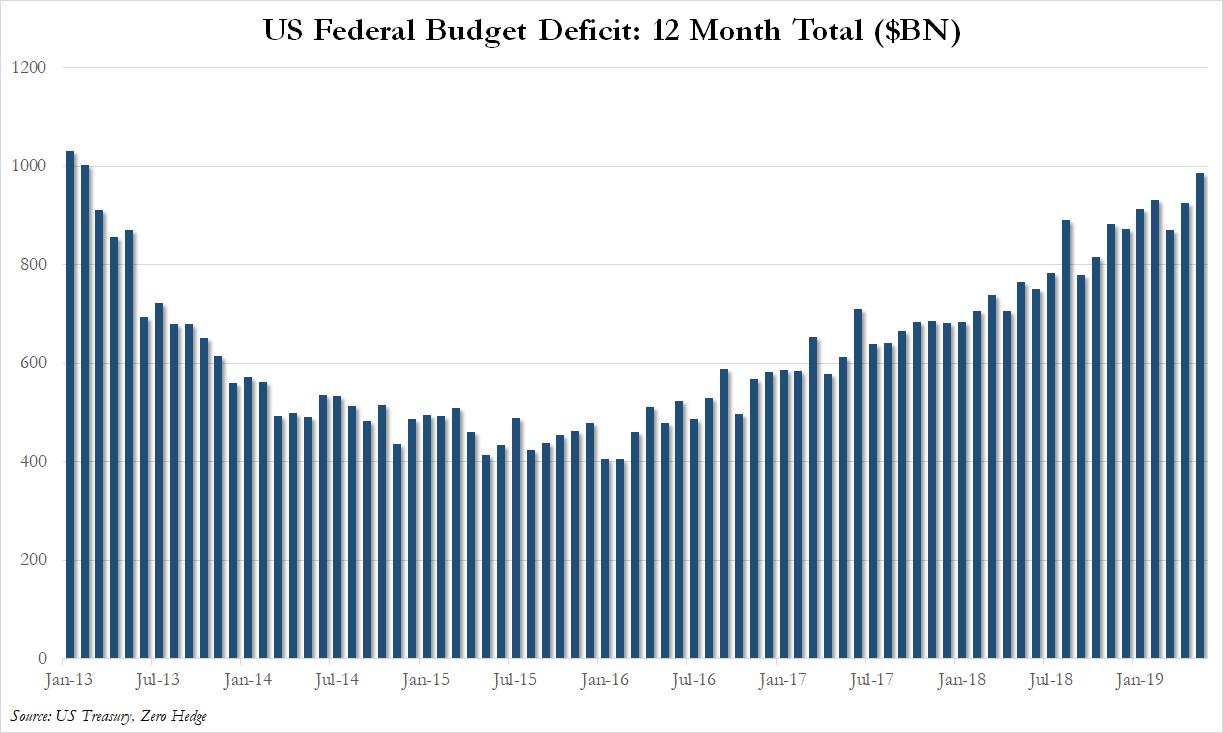
Well, that was timely. The US Treasury just posted a record $207 billion deficit for May and record monthly spending of $440 billion. That brought the rolling 12 month deficit to just shy of the trillion dollar mark at $986 billion.
The timely part is two-old. First, it just so happens that May marked month #119 of the current expansion, making it tied for the duration record with the 1990s cycle. But even JM Keynes himself would be rolling in his grave in light of the chart below.
To wit, even by the lights of hardcore Keynesians of yore, fiscal deficits were supposed to be falling sharply at the end of a business cycle or even moving into surplus as they did in 1999-2000, not erupting toward 5% of GDP as has now happened.

The second timely note, of sorts, is that the Wall Street Journal was Johnny on the Spot this AM with a front page story entitled, “How Washington Learned to Love Debt and Deficits”.
The story’s quote from the current Dem Chairman of the House Budget Committee, John Yarmouth, says it all. There simply has never been such bipartisan complacency about the nation’s public finances in all of modern history – including during the biggest borrow and spend days of FDR, LBJ and every president since Gerald Ford:
Rep. John Yarmuth (D., Ky.), House Budget Committee chairman, says he rarely hears from constituents concerned about rising deficits and debt. Many voters’ attitudes, he says: “There haven’t been any cataclysmic consequences, so why worry about it?”
The WSJ story is a dog’s breakfast of rationalizations, non sequitirs, political double-talk and Keynesian tommyrot. What is the most telling, however, is that it was co-authored by Jon Hilsenrath, who was the paper’s longtime Fed reporter. Yet it contains not a single word about the role of central banks in fostering the utter collapse of fiscal responsibility described by his lengthy report.
 Peak Trump: The Undrai...
Best Price: $12.72
Buy New $43.07
(as of 11:40 UTC - Details)
Peak Trump: The Undrai...
Best Price: $12.72
Buy New $43.07
(as of 11:40 UTC - Details)

So for want of doubt, here is the culprit. The central banks of the world have expanded their balance sheets by upwards of $22 trillion since the turn of the century, thereby massively monetizing the erupting public debt of the US and most of the world via fiat credit snatched from thin air.
So did that massive $22 trillion “buy” order from the central banks weigh heavily on the supply of funds side of the scales in the fixed income market, thereby driving bond prices skyward and yields ever lower?
Why, goodness gracious, yes it did!
The chart below drops the dime on the $22 trillion elephant in the room. Yet the current worldwide regime of Keynesian central banking has so corrupted both financial discourse and pricing in the bond pits that this central bank balance sheet explosion is treated as inert financial wallpaper – utterly irrelevant to the whys and wherefores of daily action on both ends of the Acela Corridor.
Combined Global Central Bank Balance Sheets

Moreover, the entire system is so mired in the fantasy called “debt doesn’t matter” (both public and private) that we get the chart below. Apparently, not a single one of the hundreds of high paid Wall Street analysts who cover or strategize on the fixed income markets came within a country mile of guessing where the 10-year UST yield would be today in their start of the year projections.
That is, as of January they were essentially blind, deaf and dumb as to what would materialize in a mere 180 days. And the utterly hideous level of forecast error shown below is not due to the fact that the Trade War and global growth outlook have deteriorated since the beginning of the year.

Here’s why Wall Street jabber about emerging macroeconomic weakness does not explain the above chart.
All things being equal in an honest financial system, of course, the bond market might well price-in modestly lower bond yields in the face of an expected or actual recession. The reason would be reduced demand – especially from business and consumers – for credit.
But that shouldn’t happen in today’s world because government borrowing explodes during a recession by a far larger magnitude than any offsetting reduction in demand for business working capital credit or long-term debt. And households are so extended that use of credit barely declines at all.
For instance, during the financial crisis and Great Recession, the rate of Federal borrowing soared from $161 billion in FY 2007 to $1.4 trillion in FY 2009. In cumulative terms, Federal debt outstanding on the eve of the crisis in September 2007 was $5.994 trillion and by the time the worst of the recession had passed in September 2009 the figure was $8.616 trillion.
So on the basis of honest finance, Uncle Sam alone absorbed $2.622 trillion of private savings during that two year period. But unlike the theory, household and business borrowings did not go down.
In fact, the debts of non-financial businesses (corporate and noncorporate) actually rose from $9.845 trillion in September 2007 to $10.387 trillion two years later, representing a gain of $542 billion.
Likewise, total household debt barely budged, notwithstanding the massive mortgage foreclosures which occurred during this period. To wit, household debt of $14.03 trillion in September 2007 had dipped to $13.96 trillion by September 2009, representing a tiny $65 billion decline (0.5%) decline.
 The Great Deformation:...
Best Price: $2.00
Buy New $9.95
(as of 09:55 UTC - Details)
The Great Deformation:...
Best Price: $2.00
Buy New $9.95
(as of 09:55 UTC - Details)
In sum, US Treasury demand for funds rose by $2.62 trillion during the 2007-2009 recessionary decline, but private household and business demand also rose – by a net of $474 billion.
There was no weakening of demand for borrowings at all, meaning the theory that private demand for borrowings falls during a recessionary downturn is belied by the relevant facts from the last go-round.
Whatever may have been the case back in the Keynesian heydays of the 1960s and 1970s is no longer relevant. That’s because the American economy is now entombed in $72 trillion of public and private debt – upon which the daily turning of the economic wheels vitally depend.
Accordingly, households have not de-levered since the 2008-2009 crisis, with total outstanding debt now posting at a record $15.7 trillion and business debt has veritably soared by 58% to $15.6 trillion.
So the questions recurs: Why were analysts so far off the mark on bond yields just six months ago, and why has the 10-year yield collapsed from 3.24% on November 8 last fall to just 2.096% at today’s close?

That’s a whopping 35% decline in the yield in the face of only a mild markdown of the economic outlook. And it is occurring under financial conditions which have not improved at all from the last recession, when there was no decline in private sector debt at all.
Stated differently, if the bond market was actually discounting an impending recession under current financial conditions, yields would be going up because Federal borrowing is certain to soar and private demand is virtually guaranteed to remain constant or probably rise as per 2007-2009.
Needless to say, all things are not equal and the bond market does not trade any of the facts cited above.
What it trades is the Fed and the other central banks, and it is now pricing-in a biblical flood of new liquidity that is expected to monetize the $1.5 to $2.0 trillion Federal deficits that are sure to emerge during the upcoming recession; and to do so without any “crowding out” of the now massive $31.2 trillion mountain of household and nonfinancial business debt.
But here’s the thing. The implicit assumption that indefinite and virtually infinite levels of public debt can be monetized can’t be true. Nor can the implicit assumption that the real yield on the 10-year bond can remain at virtually zero (it was 0.09% today) for the indefinite future with no harm, no foul consequences.
After all, that amounts to one epic free lunch proposition: Namely, that no one needs to save or defer gratification in the private sector because the central banks can always print enough new credit to monetize the public debt and keep interest rates aberrantly and irrationally low.
The truth is, massive central bank monetization of the debt has essentially pulled the plug on fiscal management, as underscored by today’s Wall Street Journal story, but in so doing it is also setting up the system for a thundering day of reckoning.
A hint of that can be seen in the chart below, which tracks net national savings. The latter is the real McCoy among savings measures because it subtracts today’s massive and chronic public sector dis-savings (i.e. deficits) from the meager level of positive savings generated by households and undistributed corporate profits.
It therefore shows what’s left for net investment in the private sector, and the current answer is “not much”. In fact, net national savings in Q1 2019 was just $506 billion at an annual rate.
Incredibly, that figure is 26% below the $681 billion rate recorded in Q1 of 1999. And it’s also stated in nominal dollars!
Adjusted for the 46% rise in the GDP deflator since 1999, today’s net national savings level stands at $340 billion (1999 $) or 50% below where it was exactly 20 years ago.
In a word, the radically artificial bond rates that have been generated by massive central bank debt monetization have fostered the foolish belief in the Imperial City that the public debt is benign and that borrowing a trillion dollars at the tippy-top of the business cycle is no sweat at all.
In truth, it has led to a financial metastasis down below the surface. To wit, America has been eating its seed corn (private savings) to fund the most irresponsible spree of fiscal excess in recorded history. The public debt has gone from $5.5 trillion to $22 trillion during that 20-year period, and after 30-years based on current built-in policy, the public debt will be $42 trillion or nearly 8X higher.
Stated differently, today as the economy struggles to grow after the longest, weakest business expansion ever, the private economy has 50% less in real terms to invest in future productivity and growth than it had two decades ago – and this is occurring at the worst possible moment in history.
That is, on the eve of the tsunami of Baby Boom retirements which will hit 11,600 per day by 2022 and 80 million Social Security/Medicare beneficiaries by the end of the 2020s.

What is worse, the central bankers and their Keynesian apologists who are responsible for this impending catastrophe have become actual Debt Deniers, claiming there is plenty of savings elsewhere in the world to cover America’s fiscal profligacy. Thus, the longtime head of the New York Fed and Goldman Sach’s plenipotentiary at the central bank is quoted by the WSJ as saying – nothing to sweat here:
“There are plenty of savings around the world to be invested,” says former Federal Reserve Bank of New York President William Dudley.
What he is suggesting is that apparently the prudent folks in the rest of the world have not followed the US pattern and have increased their savings rates to compensate; and, once more, are happy to send their hard-earned savings stateside to earn hardly a pittance after inflation and currency risk.
In fact, it is even more ludicrous at the moment. After adjusting for the cost of currency hedges, Mrs. Watanabe in Japan would be earning a negative return on today’s 2.096% Treasury rate.
Perhaps, the people of Japan are secretly paying America reparations for World War II. That would be as good an explanation as any – were not the entire global fixed income market in complete breakdown owing to the depredations of central banks.
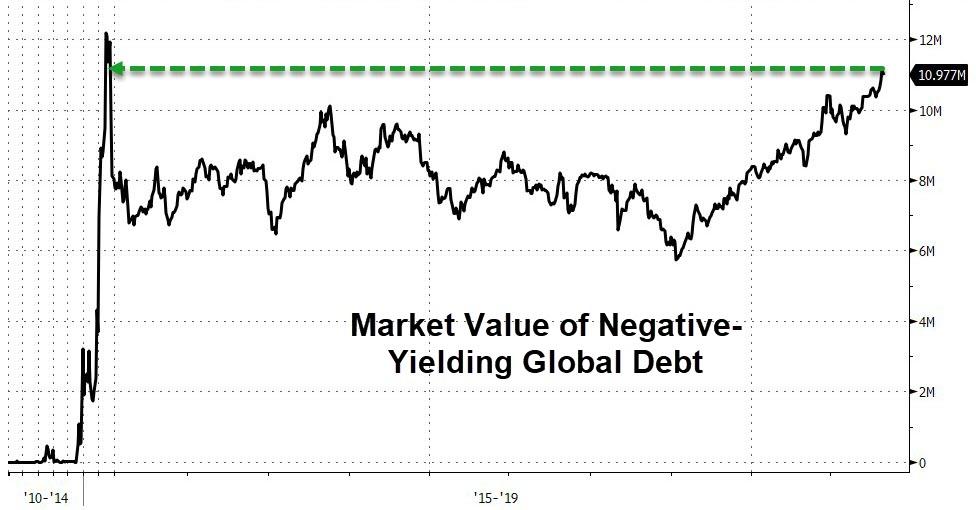
In fact, we are now apparently at near an all-time high of negative yielding debt at $11 trillion on a worldwide basis. So, indeed, somewhere on the planet there must be some kind of massive pool of stranded excess savings lapping this stuff up in order help the governments of the world make ends meet.
Except there isn’t. The alleged savings glut was invented by Bernanke and B-Dud (Bill Dudley) and it is one of the proverbial Big Lies. Most of the developed world economies, in fact, have experienced a net national savings rate decline which looks exactly like that of the US.
Relative to GDP it has been heading south for decades, and now stands at barely one-fourth of the level that prevailed during the growth heydays of the 1960s.

In the case of Japan, for instance, its net household savings rate has plummeted from 12-14% of disposable income as recently as the mid-1980s to barely 2.0% today. The image below hardly suggests that the world largest retirement colony has got a surfeit of savings to spare.

Or take the case of Australia. Just since 2008, the household savings rate has fallen more than 50%.

With respect to the major European economies, the story is the same. Since the mid-1980s, the savings rate in the UK (red line) and Italy (dark green line) has virtually disappeared. Likewise, in the case of France (light green line) and Germany (yellow line), savings rates have drifted steadily lower, albeit not so precipitately as the first two.

So where does all the purported excess savings come from?
Why, the Red Ponzi, of course!
But even that is a statistical trick owing to the Keynesian assumptions built into the national income and product accounts (NIPA). To wit, since the late 1990s, China’s total debt outstanding has exploded from $2 trillion to $40 trillion, and that massive gain has been cycled back into the economy to fund its runaway investment in public infrastructure and private industry.
In the first round of accounting, all of that new debt fuels wage and salary income and business profits. But, alas, there is no offset in the NIPA accounts for the permanent liability which funded these GDP account entries.
So, presto!
A savings glut, if you believe it.
Unfortunately, the politicians of Washington and the punters of Wall Street apparently do.
Reprinted with permission from David Stockman’s Contra Corner.
 Demolition Derby in the Gulf