


While we are waiting it might be wondered, however, whether nearly two decades of central bank financial repression have not merely destroyed honest price discovery on Wall Street. Perhaps it has actually extinguished brain function entirely among the corporal’s guard of carbon units that remain.
Yes, it is not surprising at all that the robo-machines are now gunning for the 2200 point on the S&P 500 charts. That’s what they do.
What defies explanation, however, is that the several dozen humans left on Wall Street who apparently talk to Bob Pisani are actually attempting to rationalize this “breakout” of, well, madness.
According to JPMorgan’s latest thoughts, for example, it’s all explained by Mr. Market hard at work discounting a meme called “17x/$130”.
Market update – more of the same for this market. The 17x/$130 argument continues to resonate (that combination of numbers points to 2200). It’s still very, very early in the CQ2 season but the indications so are more positive than negative (AA, Daimler, PEP, Samsung, SIMO, STX, WDC, etc) and that is helping investors look past the earnings recession and is bolstering confidence in a ~$130 number for next year.
Let’s see. Before we get to whatever massaged and medicated version of “earnings” JPM is talking about with its $130 per share number, it would be useful to start with reality.
Physical Gold & Silver in your IRA. Get the Facts.
According to Howard Silverblatt, the S&P’s authority on these matters, reported (GAAP) earnings for the March LTM finally came in at $86.44 per share.
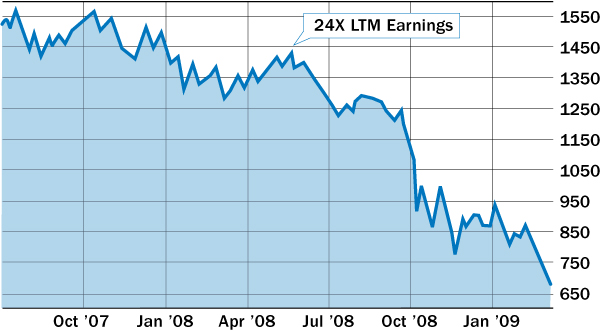
So barring some near-term earnings miracle, the market is now valued at a nosebleed 24.9X. The last time it was near that level outside of outright recession was on May 16, 2008.
At that point, March 2008 LTM earnings on a GAAP basis had posted at $60.39 per share. So when the market hit an intraday high of 1430 the implied multiple was nearly 24X.
Needless to say, it was a long way down from there. In fact, ten months later the market was 53% lower, and S&P reported earnings actually bottomed that quarter at $6.86 per share, or 90% lower.
But then, of course, who would credit GAAP?
That is, besides the several thousand white collar “criminals” domiciled in Federal hospitality facilities who undoubtedly rue the day they violated it; or the tens of thousands of bureaucrats at the SEC, DOJ and state attorneys general offices who make a living enforcing it; or the far greater numbers of white-collar defense attorneys who make an even better living parsing its fine points.
Then again, you don ‘t have to make a fetish of GAAP, even if several billion dollars annually of law enforcement and regulatory intrusion insist upon it. In fact, back in May 2008—–at a time that even the White House council of economic advisers said there was no recession in sight and Bernanke was preaching mainly blue skies ahead—-LTM operating earnings had posted at $76.77 per share, according to Howard Silverblatt.
So even using the ex-items style of earnings, the market was trading at a pretty sporty 18.6X.
Alas, a recession had already been underway for six months, but no one had bothered to tell the Eccles Building and their Wall Street acolytes. The latter are otherwise known as “street economists” and “equity strategists” of the JPMorgan ilk quoted above.
Here’s the thing. Even the LTM “operating earnings” number at the time was down by 16% from its cyclical high of $91.47 per share that had posted three-quarters earlier (June 2007 LTM). But like now, the street insisted that the “earnings bottom” was in and that 2008 profits would come in at over $100 per share or 30% higher than the March 2008 LTM actual.
At it happens, Silverblatt’s certified operating earnings number for the March 2016 LTM period was $98.61 per share.
That means that today’s market traded at 21.8X Wall Street’s preferred earnings measure. That’s even above the 18.6X delusion back in May 2008, and also something more.
Like eight years ago, the March operating earnings number is down 14%from its peak of $114.50 posted for September 2014. And also like back in 2008, expected forward earnings of $130 per share are 30% above current levels.
In truth, all of this is worse than deja vu. That’s because the casino’s financial narrative has been so corrupted by recency bias and accounting promiscuity that it has no idea what the profits picture really is or where it is going.
In a moment we will put a bullet through JPM’s $130 per share fantasy. But it is worth reiterating just how far the “earnings” narrative has departed from GAAP, and that near the end of a cycle this GAAP gap becomes especially wide.
As the WSJ recently documented, Wall Street’s ex-items or pro forma version of S&P 500 earnings came in at $1.040 trillion in CY 2015 compared to GAAP earnings of $787 billion. It would appear that CEOs and CFO’s who filed their SEC statements on penalty of prison time, averred that their actual profits were exactly $256 billion smaller than what they told their investors.
As it happens, that quarter trillion dollar fib is exactly the size of the ex-items charade back in 2007. It seems as if companies actually need a periodic recession so that they can toss into the kitchen sink the write-offs for all the dumb deals and investment mistakes they made while the bubble was still inflating.

In any event, not only are Wall Street’s hockey sticks extremely crooked from an accounting point of view, but they are also egregiously predictable in the magnitude by which they deflate as one-year forward estimates are eventually overtaken by reality.
To wit, in March 2014, the one-year forward estimate for CY 2015 came in at$135 per share of “operating earnings” for the S&P 500. At length, CY 2015 unfolded—-bringing with it a collapse of oil and materials prices and a sharp slowdown in global growth that came as a big surprise to Wall Street.
Accordingly, Silverblatt now certifies that actual operating earnings for CY 2015 came in at $100.45 per share. Apparently, in a world where “one-timers” don’t count, that gigantic 26% miss doesn’t count, either.
That’s because, in March 2015, the street “bottoms up” consensus for 2016 was pegged at, yes, $135 per share, again.
The problem is that the 2015 hockey stick has already been rolled down to just $114 per share as of June. Yet even if Q2 comes in at the current estimate of $28 per share and there is no further earnings decline in Q3 and Q4, earnings will total just $100 per share for 2016. That would be another 25% miss.
Never fear. The street consensus estimate for 2017 as of this March was $136 per share for the third year in a row.
That JPMorgan has already walked it down to $130 per share, therefore, is not the least bit surprising. Walking it back is what equity analysts do.
Then again, according to Howard Silverblatt, operating earnings for the current LTM period (June 2016) are expected to come in at just $100.55 per share.
Yet why is the implicit 30% climb from here to get to JPM’s magic “17X” on next year’s earnings any more plausible than was the outlook back in July 2014?
Back then, LTM operating earnings posted at $112 per share and the expectation was for a 20% gain on a year forward basis for 2015.
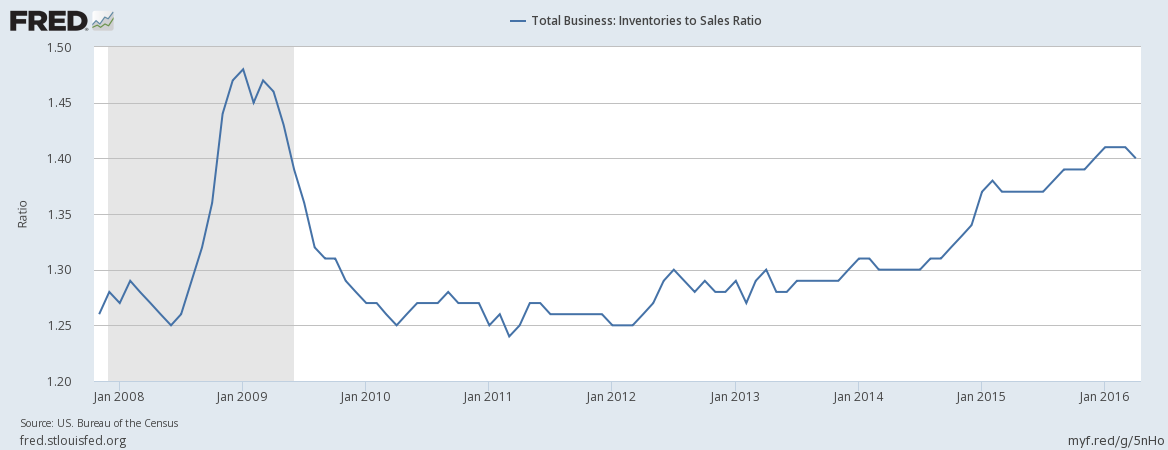
In fact, since July 2014 total business sales in the US economy have declined by 6% and the inventory to sales ratio has soared from an already high 1.3X sales to 1.41X. That’s recession territory.
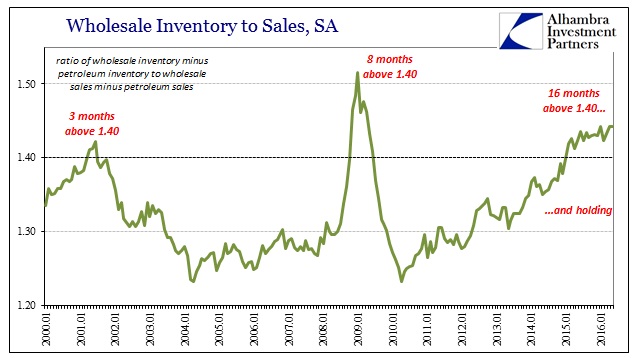
In the case of wholesale sales, as reported today, Jeff Snider notes in a nearby post that the warning signs of recession are flashing even brighter. At 1.44X, the non-petroleum inventories-to-sales ratio is heading for the highs of the Great Recession.
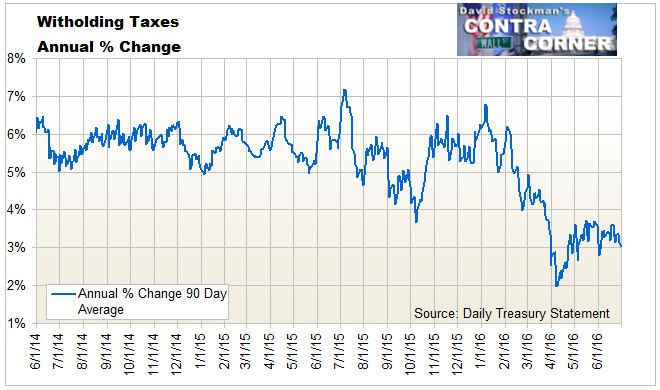
Likewise, unlike the BLS’s monthly random numbers generator, the treasury tax collections do not lie. And they do not reflect taxes paid by real world employers for phantom workers on account of seasonal maladjustments, birth-death imputations or trend-cycle adjustments to actual payroll records.
As we showed last week, the 90-day moving average of payroll tax collections in June had dropped from last year’s 5-6% Y/Y trend to barely 3%. This means that after allowance for average hourly pay gains of 2.6% since last June, labor hours worked in the US economy are evidently at stall speed.
That probability is reinforced by two other straws in the wind.
First, total Federal tax collections—-including upper income estimated payments, corporate taxes, and excise taxes—-at $181 billion in June were flat over the prior year. That’s a radical departure from the hefty gains registered since anti-recession tax cuts expired in 2013.
Likewise, the recovery of incomes among the top 10%-20% of households since 2009 has generated solid gains in restaurant and bar sales. During the seven years after the May 2009 bottom, sales growth averaged 5.5% per annum.
But in June, the Knapp-Track data for the core fast casual sector showed that traffic was down 4.8% compared to last year and sales were down 2.3%.
In a similar matter, the Cass freight index is now running sharply lower than at any time since 2013, meaning the pace of business activity in the US economy is cooling rapidly.

At the end of the day, the “17x/$130” meme is not even a case of eye’s wide shut daredevilry.
That is, not in a world with $13 trillion in subzero sovereign debt, liquidity soaked markets riddled with FEDs (financial explosive devices), the Red Ponzi teetering more dangerously every week, the Italian and European banking system slinking toward the brink, crude oil heading back down for the count, Japan contemplating fiscal hari-kari, and countless more.
It’s also an insult to intelligence in a world where bulging inventories remind that the business cycle has not been abolished, where faltering US exports matter on the margin, where 90% of households are tapped out and where corporate America is buying back its stock, not investing in maintenance of the capital stock, let alone improvement and growth.
To say the least, there is no reason whatsoever to believe that the domestic and global economies will come bounding back anytime soon. A 30% gain in corporate profits during the next 18 months is not even a remote possibility.
Actually, the latter proposition is proof positive that the casino has been largely emptied of human intelligence. It apparently remains occupied by a motley assembly of brigands and snake oil vendors who are calling the greater fools to one final slaughter.
Given the evident facts of life, you can’t say the latter don’t deserve exactly the condign punishment the economic gods surely have in store.
Reprinted with permission from David Stockman’s Contra Corner.

