


Gold Market Update
July 12, 2016
Over the longer-term the prospects for both gold and silver are very bright indeed, because of the inexorable global trend towards hyperinflation, driven by the stark reality that there is now no way back for the Keynesian extremists who have created the present shambles. Given the current debt structure, any serious attempt to “apply the brakes” will result in a total implosion and collapse of the system, which will disappear into a neutron star like black hole. They therefore have to keep ballooning the money supply and debt until the system is eventually consumed by a hyperinflation firestorm, which will be a more gradual process than a deflationary implosion, which would by comparison be an instantaneous event. This continued exponential debasement of fiat of course means that real money, gold (and silver), which holds its value, must rise in price exponentially to compensate.
Over the short to medium-term both gold and silver look set back to react back significantly, both for fundamental and technical reasons, and we will concentrate on looking at the latter in this update.
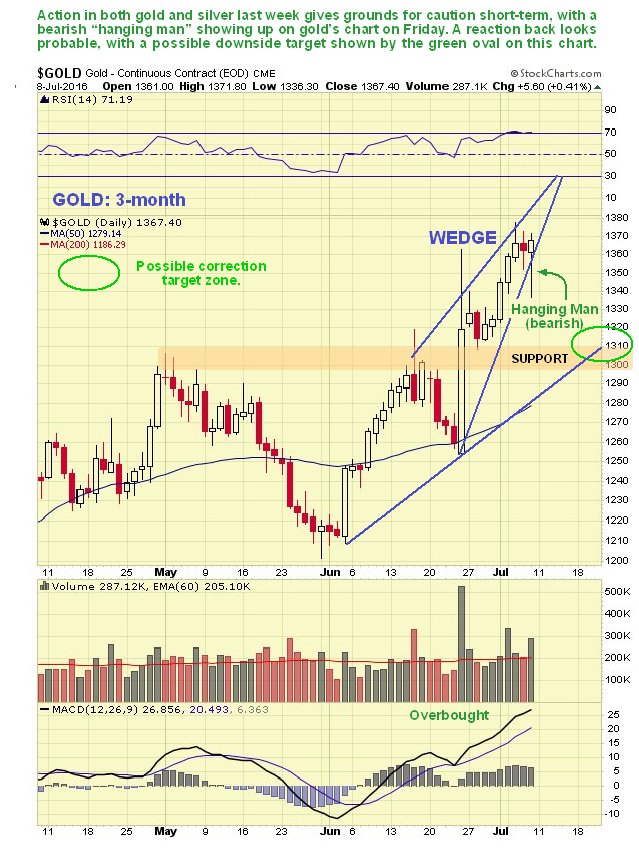
On gold’s 3-month chart we can see that following its big Brexit up day, it has continued to rise, but in a rather hesitant manner, and the pause of recent days with a bearish looking “hanging man” candlestick appearing on the chart on Friday, suggests that a bearish Rising Wedge is completing which will lead to a drop soon. We are not talking about a serious drop here, but it could react back to the green oval target zone drawn shown on the chart at the lower channel line and earlier peaks, where there is significant support.
Myths, Misunderstandings and Outright lies about owning Gold. Are you at risk?
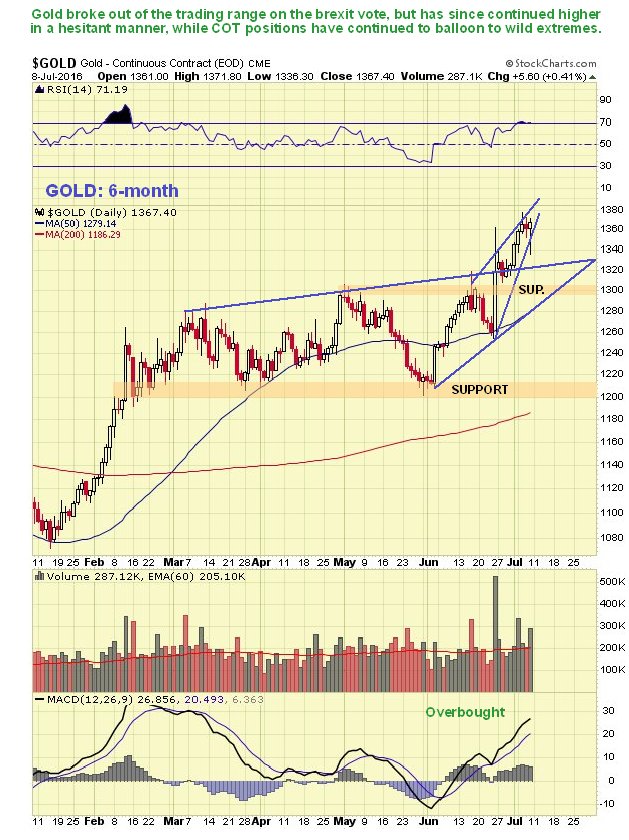
The 6-month chart looks overall positive, but there are two factors that point to an intermediate reversal here that are not visible on this chart, which are that gold has arrived at a target shown on its long-term arithmetic chart, and that its latest COTs are at wild extremes, which we will shortly see, which usually means trouble.
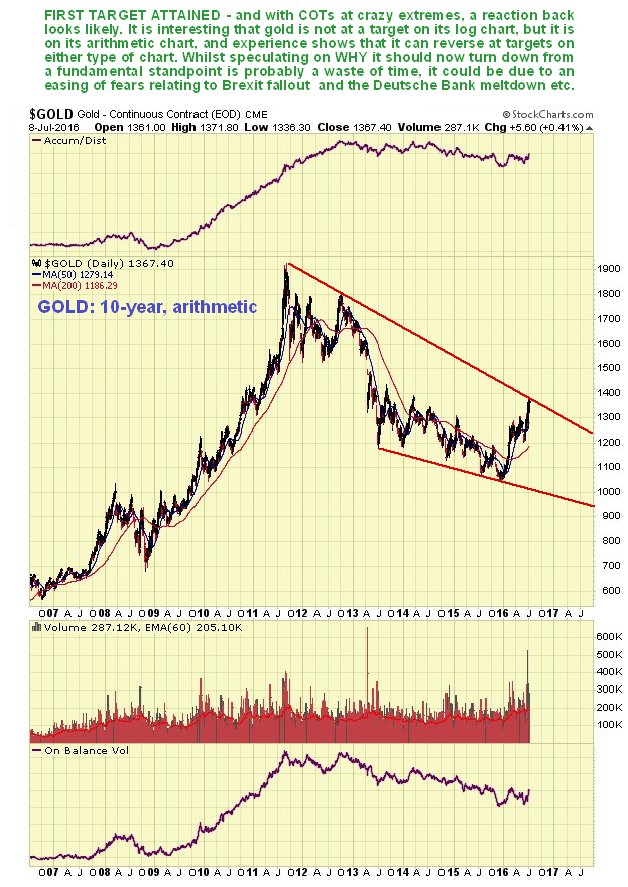
On gold’s 10-year arithmetic chart we can see that it has arrived at trendline resistance at the boundary of the large converging downtrend channel in force from 2011, and it also close to resistance at its 2014 high. If it’s going to turn lower soon, this is a good point for it to do so. The volume indicators shown on this chart are not very encouraging at this point.
The most worrying factor for those of a more prudent disposition is that the Large Specs are all-out raving bullish now, as we can see on gold’s latest COT chart below. Meanwhile the Commercials, who always come out on top in the end, have simply piled up their shorts to higher and higher levels, as gold as continued to advance.
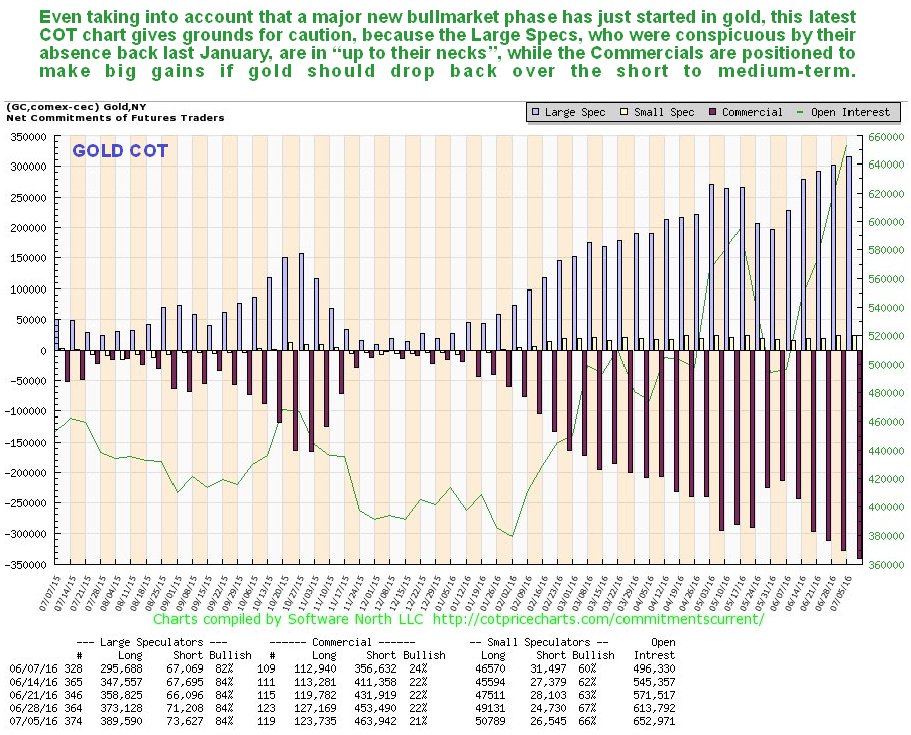
The COT chart shown above, which only goes back a year, probably doesn’t drive home just how extreme the current situation is. If not, then the following chart should get the job done. The long-term Hedgers chart shown below, which is a form of COT chart, shows that Hedgers positions are now at frightening bearish extremes. When the reading reaches the red dotted line it is at a normal bearish extreme, which often, but not always, leads to a drop in the gold price. When the reading is way below it, as now to an unprecedented extent, the situation is critical, and please note that I didn’t create this chart, sentimentrader did, and they are not known for being anything other than totally objective.
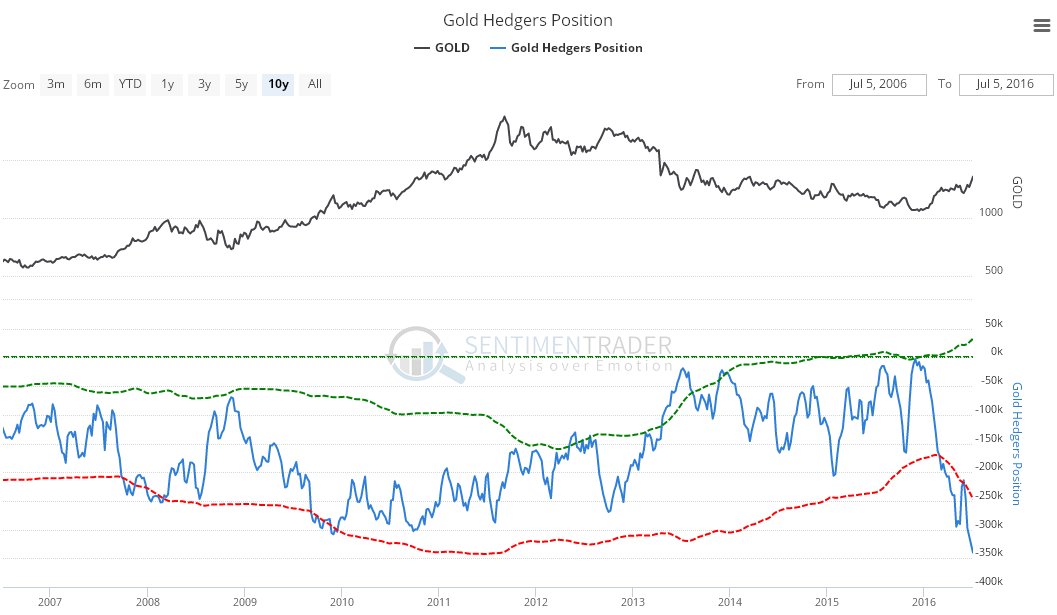
Chart courtesy of www.sentimentrader.com
Your reaction to all this depends first of all in whether you follow the logic of it and agree with it or not, and secondly on what sort of investor or trader you are. If you are a long-term investor, you may simply decide to ride out any correction, but if on the other hand you are aggressive trader, you may want to cash in longs and even consider opening some shorts in the sector, but whichever, it still looks like a good idea to take some money off the table here if you are long the sector, taking advantage of the comparatively high prices now prevailing.
As for possible fundamental reasons for a drop in gold and silver soon, these are a matter of conjecture, but one possibility is an easing of recent extreme fears surrounding the fallout from the Brexit vote, and of Deutsche Bank or Italian banks imploding, with Central Banks and governments riding to the rescue with huge war chests of freshly printed banknotes.
Originally Published July 10th, 2016.
Reprinted with permission from CliveMaund.com.
 The Big Short: Inside ...
Best Price: $1.49
Buy New $7.99
(as of 02:35 UTC - Details)
The Big Short: Inside ...
Best Price: $1.49
Buy New $7.99
(as of 02:35 UTC - Details)

 Money and Power: How G...
Best Price: $2.14
Buy New $9.60
(as of 08:50 UTC - Details)
Money and Power: How G...
Best Price: $2.14
Buy New $9.60
(as of 08:50 UTC - Details)
 The New Case for Gold
Best Price: $0.25
Buy New $6.99
(as of 11:36 UTC - Details)
The New Case for Gold
Best Price: $0.25
Buy New $6.99
(as of 11:36 UTC - Details)
 The Death of Money: Th...
Best Price: $0.25
Buy New $3.50
(as of 10:20 UTC - Details)
The Death of Money: Th...
Best Price: $0.25
Buy New $3.50
(as of 10:20 UTC - Details)
 Rise of the Mediocre