


Why This Feels Like a Depression For Most People
October 9, 2015
“And the little screaming fact that sounds through all history: repression works only to strengthen and knit the repressed.” – John Steinbeck, The Grapes of Wrath
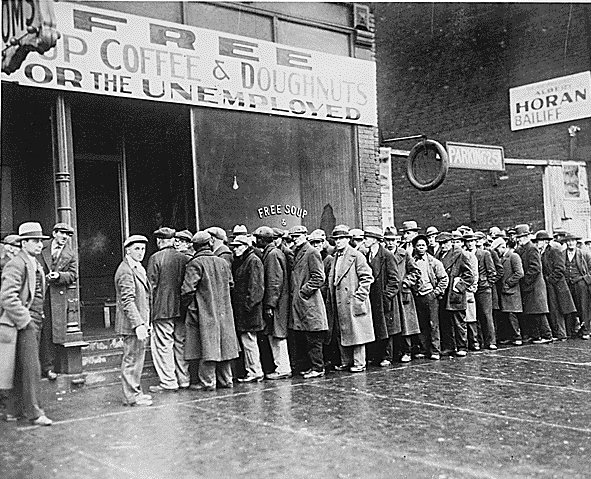
Everyone has seen the pictures of the unemployed waiting in soup lines during the Great Depression. When you try to tell a propaganda believing, willfully ignorant, mainstream media watching, math challenged consumer we are in the midst of a Greater Depression, they act as if you’ve lost your mind. They will immediately bluster about the 5.1% unemployment rate, record corporate profits, and stock market near all-time highs. The cognitive dissonance of these people is only exceeded by their inability to understand basic mathematical concepts.
 The Grapes of Wrath
Best Price: $0.36
Buy New $7.74
(as of 07:55 UTC - Details)
The Grapes of Wrath
Best Price: $0.36
Buy New $7.74
(as of 07:55 UTC - Details)

The reason you don’t see huge lines of people waiting in soup lines during this Greater Depression is because the government has figured out how to disguise suffering through modern technology. During the height of the Great Depression in 1933, there were 12.8 million Americans unemployed. These were the men pictured in the soup lines. Today, there are 46 million Americans in an electronic soup kitchen line, as their food is distributed through EBT cards (with that angel of mercy JP Morgan reaping billions in profits by processing the transactions).
These 46 million people represent 14% of the U.S. population. There are 23 million households on food stamps in a nation of 123 million households. Therefore, 19% of all households in the U.S. are so poor, they require food assistance to survive. In 1933 there were approximately 126 million Americans living in 30 million households. The government didn’t keep official unemployment records until 1940, but the Department of Labor estimated 12.8 million people were unemployed during the worst year of the Great Depression or 24.9% of the labor force. By 1937 it had fallen to 14.3% or approximately 8 million people.
The number of people unemployed during the 1930’s is an excellent representation of the number of households on government assistance during the Great Depression because 79% of all households were occupied by married couples with 4 people per household versus 48% married couple households today with 2.5 people per household. The unemployment rate averaged 19% during the heart of the Great Depression. Therefore, approximately 19% of all the households in the U.S. needed government assistance to feed themselves. That happens to be the exact percentage of households currently needing food stamps to feed themselves.
 The Grapes of Wrath
Best Price: $4.35
Buy New $30.49
(as of 09:05 UTC - Details)
The Grapes of Wrath
Best Price: $4.35
Buy New $30.49
(as of 09:05 UTC - Details)
We are now supposedly five years into an economic recovery. The unemployment rate, according to the government, has fallen from 10% to 5.1%. Maybe a comparison to the the Great Depression in 1937, five years after the worst of it, would reveal some truth. It is not easy to do an apples to apples comparison because very few women worked outside the home in 1937 and the average life expectancy in the 1930s was 60 years old. Today, the majority of women are theoretically in the work force and the average life expectancy is 78 years old. In 1937 only 5% of the population was over 65 years old versus 13% today.
There were approximately 55 million Americans in the labor force in 1937, according to the DOL, and approximately 47 million of them were employed. So 85% of the eligible work force was working. There was no BLS to massage, manipulate, seasonally adjust, or fake the data to make things appear better than they were in 1937. Edward Bernay’s Propaganda techniques and methodologies weren’t perfected for a few more years. According to Census information there were 52 million Americans between the ages of 18 and 44, along with another 21 million between the ages of 45 and 64 in 1937. So even considering that very few women worked and many people died by the age of 60, we had a workforce of 55 million out of an age eligible population of 73 million at a maximum. That yields a participation rate of 75%.
 Check Amazon for Pricing.
These facts reveal the utter falsity of the propaganda drenched duplicitous data dumped by the BLS on behalf of vested interests who have captured our government and have an agenda requiring the public to be kept in the dark regarding their own dire financial situation. No matter how you slice the data, it reveals an absolute parallel to the situation during the Great Depression. There are 251 million Americans of working age and only 149 million are employed, of which 20 million are part-time and 8 million are self employed. Only 59% of working age Americans actually work. The BLS has the cajones to declare that only 157 million of the 251 million working age Americans are actually in the labor force.
This outrageous assumption flies in the face of all reasonableness, facts, and truth. In 1937, even with women not working outside the home and very few people living past 65 years old, the participation rate was 75%. Today, with the majority of women capable and willing to work and older Americans working well into their 60s, the BLS actually expects a critical thinking person to believe the participation rate is only 62.4%, the lowest since 1977. It’s a pure and simple despicable lie. The true participation rate should exceed the rate in 1937, based on the facts. Using the 75% participation rate today, yields a true unemployment rate of 21%, not the preposterous 5.1% shoveled by the bullshit artists at the BLS. The 21% rate ties very closely to the figure arrived at by John Williams at Shadowstats. An unbiased assessment of the facts reveals unemployment numbers and people on government assistance numbers that match or exceed those of the Great Depression.
Copyright © 2015 The Burning Platform
 Don’t Call Us a Stan!