


Why Yellen & The Feds Are Bubble Blind——They Apparently Believe Wall Street’s EPS Scam
March 26, 2015
Surveying the Fed’s handiwork during last week’s press conference, Janet Yellen noted that all was awesome except that stocks were now slightly “on the high side” of their historical range. You can say that again!
In fact, you can say that any one capable of uttering such tommyrot has been totally bamboozled by Wall Street’s sell-side con artists. Yes, the latter surely need to be monitored by the Feds. But that would be the kind of “Feds” who operate Uncle Sam’s non-elective hospitality facilities.
Take the Russell 2000 stock index. That’s smack dab in the Fed’s wheelhouse because upwards of 90% of the sales and earnings of the Russell 2000 are from domestic sources. So among the
 Economics in One Lesso...
Best Price: $2.43
Buy New $7.43
(as of 12:35 UTC - Details)
Economics in One Lesso...
Best Price: $2.43
Buy New $7.43
(as of 12:35 UTC - Details)
 various market indicators, the small and mid-cap stocks which comprise the index should best capitalize the good works emanating from the Eccles Building. After all, the masters of the world’s reserve currency domiciled there profess no interest in the dollar’s exchange rate and aver that they can micro-manage the US economy because it is a closed bathtub not impacted by wages, prices and capital flows from abroad.
Well, the Russell 2000 closed at a new all-time high on Friday. At its index value of 1266 it is now up 260% from is post-crisis low. Undoubtedly, the nation’s labor-economist-in-chief believes that’s all to the good. But then surely no one told her it represents a valuation multiple of just about 90X LTM (latest 12 months) earnings reported by the 2000 companies which comprise the index, and which were certified as accurate by 4,000 CEOs and CFOs on penalty of jail time.
The mystery of how the Fed remains so stubbornly bubble blind—-just like it did during the dotcom and housing bubbles—is thus revealed. The self-evident reason is that the purported geniuses who comprise our monetary politburo drink the Wall Street Cool-Aid about forward ex-items EPS.
 Against the State: An ...
Best Price: $5.02
Buy New $5.52
(as of 11:35 UTC - Details)
Against the State: An ...
Best Price: $5.02
Buy New $5.52
(as of 11:35 UTC - Details)
In the case of the Russell 2000, this Wall Street confected version of the EPS multiple as of last Friday was 19.9X—–or just like the lady said, a tad on the high side but nothing to sweat about. Why not keep the pedal-to-the-metal awhile longer?
But here’s the thing. We have a yawning gap here. After sell-side analysts got done tracing their all-seasons hockey sticks several quarters into the future and finished deleting any expected charges to earnings that might plausibly be dismissed as “non-recurring”, the implied forward ex-items EPS for the Russell 2000 disseminated by Wall Street was exactly $63.87 per share.
By contrast, the actual 4-quarter GAAP result through December 2014 reported to the SEC was $14.18 per share. Needless to say, to blithely ignore this blinding difference—as surely Yellen did—-is an egregious dereliction of duty.
 Meltdown: A Free-Marke...
Best Price: $0.25
Buy New $20.00
(as of 02:20 UTC - Details)
Meltdown: A Free-Marke...
Best Price: $0.25
Buy New $20.00
(as of 02:20 UTC - Details)
And the reason is this: The Fed has caused two thundering stock market bubbles and crashes already this century—–which resulted in $8 trillion and $10 trillion of devastating losses, respectively. Moreover, these cliff-diving crashes happened suddenly and were consummated within a matter of months, meaning that the Wall Street insiders and fast money traders got out and then returned to scavenge the bottom, while the main street homegamers took it in the chin twice.
So you would think that people who believes a few places to the right of the decimal point on the CPI make a big difference might wonder about $14 per share versus $64; and, most certainly, investigate whether this yawning GAAP is some type of temporary aberration or simply par for the course in the casino.
 The Great Deformation:...
Best Price: $2.00
Buy New $9.95
(as of 09:55 UTC - Details)
Indeed, they most surely should wonder about the following: One year ago, the LTM GAAP earnings for the Russell 2000 was exactly $14.10 per share for CY 2013. So the $14.18 per share reported for 2014—– on GAAP earnings numbers that you won’t go to jail for—-means thatthe Russell 2000 has gained the munificent sum of eight pennies or 0.6% during the past year.
The Great Deformation:...
Best Price: $2.00
Buy New $9.95
(as of 09:55 UTC - Details)
Indeed, they most surely should wonder about the following: One year ago, the LTM GAAP earnings for the Russell 2000 was exactly $14.10 per share for CY 2013. So the $14.18 per share reported for 2014—– on GAAP earnings numbers that you won’t go to jail for—-means thatthe Russell 2000 has gained the munificent sum of eight pennies or 0.6% during the past year.
That’s right. America’s hometown stock index is trading at 90X based on an earnings growth rate of less than 1%. A tad “on the high side” indeed.
Moreover, none of the Wall Street defenses for using the forward ex-items profit figures can withstand serious scrutiny. The casino has become so corrupted and bubbled up that the numbers are not worth the paper they are printed on.
Consider a brief history of Wall Street’s ex-items projection for S&P 500 earnings for CY2014. Exactly two years ago, that figure was about $125 per share. At the time, it was just another case of look ma, everything’s normal.
 Dark Pools: The Rise o...
Best Price: $6.32
Buy New $11.74
(as of 06:25 UTC - Details)
Dark Pools: The Rise o...
Best Price: $6.32
Buy New $11.74
(as of 06:25 UTC - Details)
The S&P was then trading at 1560—–so the implied two-year forward multiple was 12.5X. By one year-ago, the Wall Street hockey stick had shrunk to $120 per share—–which then represented just 15.5X the nine-month forward earnings figure for 2014 based on an index price of 1870.
Needless to say, any CNBC talking head would have told you that these multiples were completely normal and that stocks still had “room to run”. And that part would have been true. Last Friday the S&P 500 closed at 2108 or up by 35% from two years-ago and 13% from March 2014.
Alas, the ex-items earnings figure for 2014 is now actually recorded, and its the part which isn’t up. All those bottoms-up hockey sticks turned out to be a tad optimistic because the number actually came in at $113 per share or 10% lower than its two-year ago outlook. And as to the GAAP stay-out-of-jail version of profits, the number for 2014 came in at $102 per share.
 Broken Markets: How Hi...
Best Price: $7.44
Buy New $24.98
(as of 05:40 UTC - Details)
Broken Markets: How Hi...
Best Price: $7.44
Buy New $24.98
(as of 05:40 UTC - Details)
So it turns out the S&P 500 is being capitalized at 20.6X actual GAAP EPS. Other than during recession quarters, the only time the S&P multiple was recently even close to that was in Q3 2007, when the LTM multiple was 19.4X. Even the Fed heads recall what happened next.
And, no, the difference between honest GAAP earnings and Wall Street’s ex-items version is not a matter of subjective preference. Non-recurring charges for asset write-offs, goodwill reductions, employee severance and other so-called restructuring costs are real expenses that consume cash and/or destroy corporate capital. For any given company honest GAAP earnings can be “lumpy” from period to period, but that can be solved by amortizing, not eliminating, these charges.
And as to the S&P 500 basket as a whole, even the “lumpy” canard is not really an issues because for many years now the difference between GAAP earnings and ex-items profits has ranged consistently between 8-15%. The lumps wash out when it comes to the entire index.
 The Secret Club That R...
Best Price: $2.23
Buy New $16.87
(as of 09:55 UTC - Details)
The Secret Club That R...
Best Price: $2.23
Buy New $16.87
(as of 09:55 UTC - Details)
Over any reasonable period of time, however, this 8-15% gap adds up to some real money. During the eight years encompassing 2007 through 2014, in fact, GAAP earnings reported to the SEC by the S&P 500 companies have cumulated to about $5 trillion—–while ex-items earnings ballyhooed by Wall Street have totaled around $6 trillion. There is a distinct possibility that this $1 trillion difference is not just a rounding error when it comes to valuation!
More importantly, as the Fed’s bubble cycles get long-in-the-tooth, the forward ex-items hockey sticks tend to get steeper; and over the decades, the creativity of the sell-side in deleting “non-recurring” charges has gotten considerably more acute. Accordingly, comparisons of today’s ex-items multiples with purported long-term average multiples is a proverbial case of apples and oranges.
Some sense of that is evident in the graph below, which is based on trailing earnings on a GAAP basis. It shows that as of June 2014, the median PE multiple for all NYSE stocks with positive earnings was at an all-time high——even exceeding the lofty heights of the dotcom bubble years.
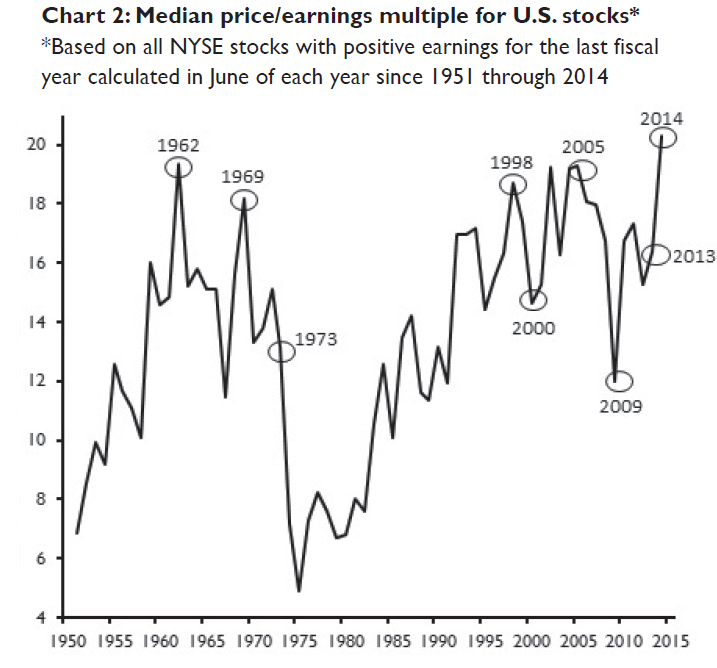
And that’s not the half of it. In today’s Fed sponsored casino there are far more companies with negative earnings and large capitalizations than in those benighted times decades ago when “price discovery” still existed. So that brings us to the stupendous biotech bubble that even Yellen claims to have recognized back in June of 2014.
Since then the NASDAQ biotech index is up another 50%—–bringing the index to 6X its March 2009 bottom. But even then the real valuation absurdity is not fully apparent on the surface. As Zero Hedge documented the other day, the 150 companies in the index have a collective market cap of $1.06 trillion, but only $21 billion of LTM earnings, implying a PE multiple of 50X.
But rollover Russell 2000—–you haven’t seen nothing yet. The 5 big cap biotechs in the index—-Gilead, Amgen, Shire, Biogen and Celgene—had net income of $25.5 billion during the most recent LTM period—-or well more than the index total. If you add in the next 20 positive earners, you get to $30.5 billion of net income or 145% of the $21 billion reported by the entire basket of 150 companies.

So the internals shape up this way. The Big 5 had a market cap of nearly $550 billion or did last Friday before today’s Gilead stumble which took the index down by about $20 billion. And the next 20 traded at a collective value of $230 billion, meaning that the market cap of the top 25 companies in the index (which accounted for 145% of total earnings) was about $780 billion.
Needless to say, the math here implies something rather astounding.Namely, that there are 125 companies in the NASDAQ biotech index which are valued at $280 billion, but posted aggregate losses of nearly $10 billion in the most recent LTM reporting period.
So yes, Janet, there is a bubble in biotech and its a doozy. It amounts to well more than one-quarter trillion dollars of bottled air. Its a direct result of six years of free ZIRP money to the carry trade gamblers and Wall Street’s self-evident confidence that the Fed is petrified of a hissy fit and will not hesitate to keep the juice flowing indefinitely—– even if it’s called a 25 bps increase in the money market rate, eventually.
The stupendous extent of the biotech bubble—and its merely representative—–can be seen in the free market contrafactual. That is to say, what would these 125 negative earners in the biotech index have to generate when they grow-up in order to earn-out there current $280 billion market cap?
Well, the Big 5 trade at 21X earnings and with $68 billion of combined revenues they reported a five-year sales growth rate of 16.5% per annum. So when you get to quasi-stable maturity even in the Fed’s casino it takes one small sized mountain of sales to earn even a middling sized multiple. But whoops——half of the big 5 LTM profits were accounted for by Gilead, which had an LTM net profit rate of 49% on $25 billion of sales. By contrast, the more typical net income margins of Biogen and Amgen were 30% and 25%,respectively.
Even more to the point, the net income margin of the next 20 companies—–represented by names like Mylan, Alexion, Biotechnic and Luminex was 17.5%, while the PE multiple of these earlier stage companies was a frisky 47X. And frisky is indeed the correct term because their 5-year revenue growth rate was only slightly higher than the Big 5 at 21%.
In short, give these 125 cash burning negative earners and virtually salesless biotechs a grown-up PE multiple of 20X and a net income margin of 20%. That means they would need to generate $70 billion of sales from today’s cold start. Good luck with that, and with the near ZIRP discount rate that is implied by the amount of time that would be required to get from here to there.
Indeed, speaking of the amount of time required to get from zero to 60 mph, Elon Musk has finally explained why Tesla is worth $35 billion. That is, despite the fact that it has never generated a dimes of net income; has in fact posted net losses of $1.4 billion since Goldman started flogging it in 2007; and can’t possibly compete with the likes of Toyota and BMW in scaling up to the mass market volume that is implied in its current infinite multiple.
It turns out that Musk believes Tesla is actually peddling a death trap, and foresees a world in which the testosterone-riven rich men who buy his vehicles today will be prohibited from even driving their own cars. Stated differently, he is now admitting that the market is capitalizing his driverless car vision——-to go along with his Mars Shuttle and warp speed trains:
So what happens when we get there (to driverless cars)? Musk said that the obvious move is to outlaw driving cars. “It’s too dangerous,” Musk said. “You can’t have a person driving a two-ton death machine”.
No less than investment guru Jim Cramer now gets the joke. Back in early February, Cramer issued his own broadside:
“Clean up your act, Musk—Tesla’s a total disaster!…….. No way the balance sheet can support the investment needed……. Musk confirmed that it will be spending staggering amounts of money on capital expenditures….. Where the heck is this money going to come from?”
That about sums up the “high side”. The Fed is driving a two-ton bubble machine, but has no clue that it has become a financial death trap.
Reprinted with permission from David Stockman’s Corner.
 Does Singapore Suffer From a Lack of Democracy?