


Fibonacci: Gold Stocks Thermometer
June 25, 2012
The US Bond market is a debt market. Evaluating the US bond from a fundamental view point shows there are several things that make the US bond a long term investment to avoid.
The dollar is being diluted by the Federal Reserve’s quantitative easing programs. Upon maturity, bond investors are set to be paid with a currency worth much less than when the bond was issued.
Most governments seem to be hopelessly addicted to spending money. The debt in the United States is now nearing $16 trillion, which is an amount too large to be honestly repaid.
The deficit is now growing by roughly $1 trillion every year. It overwhelms GDP growth. For every dollar collected in tax revenue, an additional dollar is being borrowed. Higher taxes can’t fix the economy. They will slow it down and create even bigger deficits.
From a technical stand point, the bond is overbought, yet it could become even more overbought.
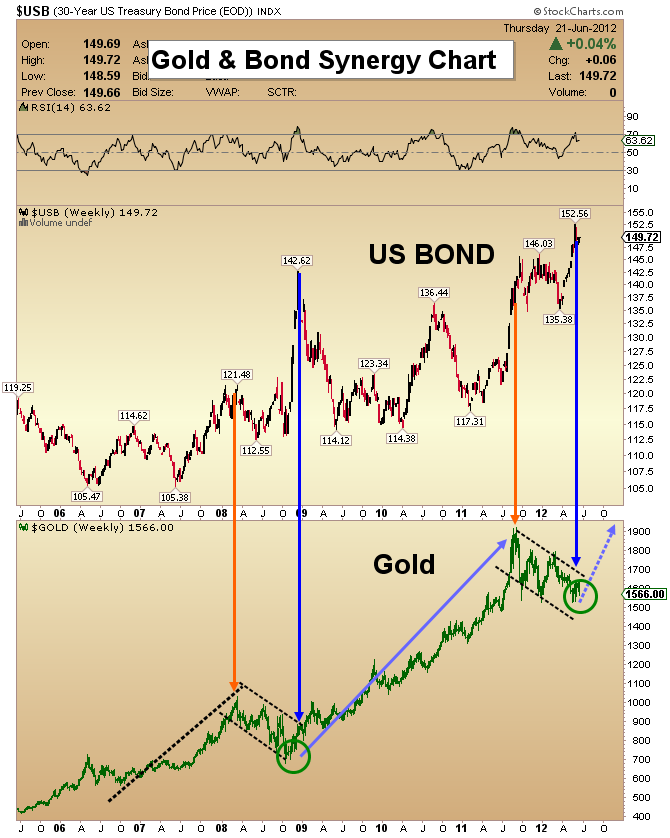
The gold & bond synergy chart that I am highlighting this week shows how the bond’s price action can signal the end of a gold market correction.
Note the bullish rectangle technical pattern on gold in 2008, and how similar that is to today’s market. When bond prices are substantially extended, as they seem to be now, gold can begin a big move higher.
Why become a creditor and buy debt you probably can’t collect on, when you can buy gold instead?
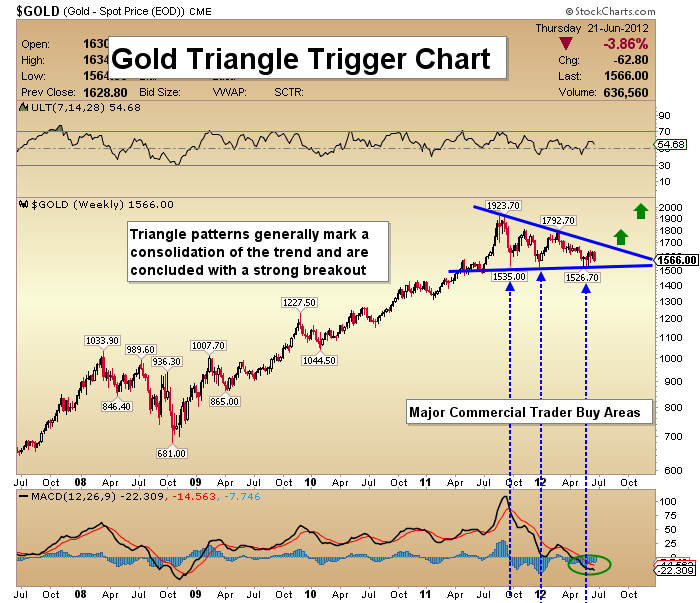
Gold appears to be completing its correction. A triangle formation is very bullish, and the MACD indicator at the bottom of this chart will likely be the trigger that shoots the gold bullet up and out of this triangle.
Because this price pattern is most prominent on the weekly chart, it carries more “technical weight” than if it only appeared on a daily one.
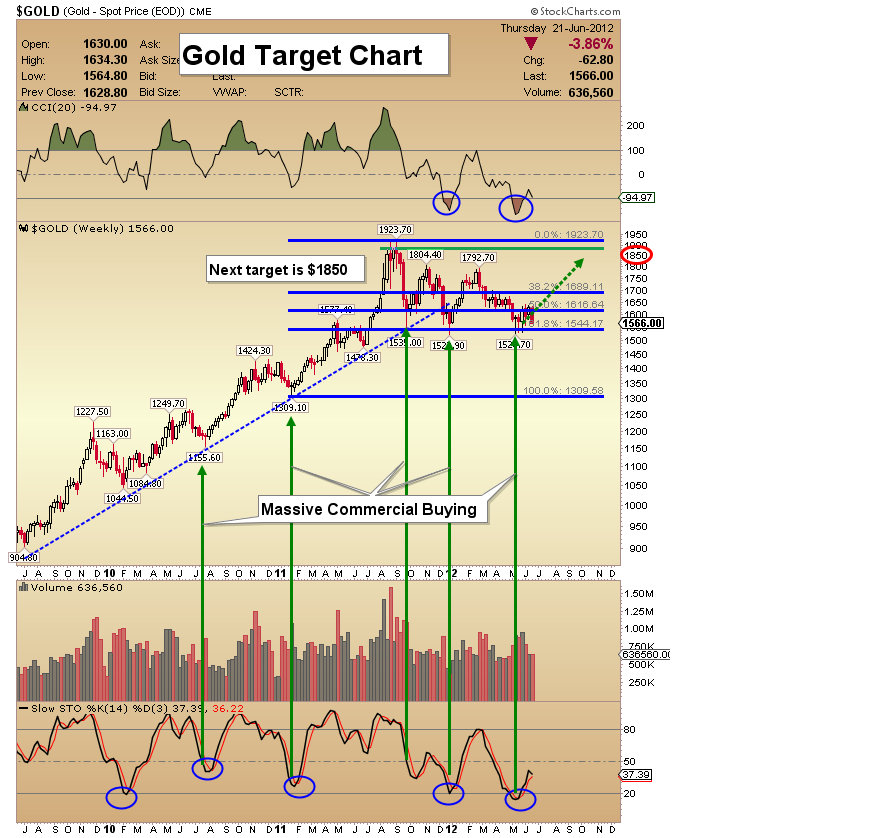
The 61.8% Fibonacci retracement line of the move from about $1309 to $1923 has been the main support for gold at the lows of this correction. Substantial commercial buying has occurred each time the price has declined towards $1544.
The posture of the “Slow Stokes” and the CCI indicator are also bullish.
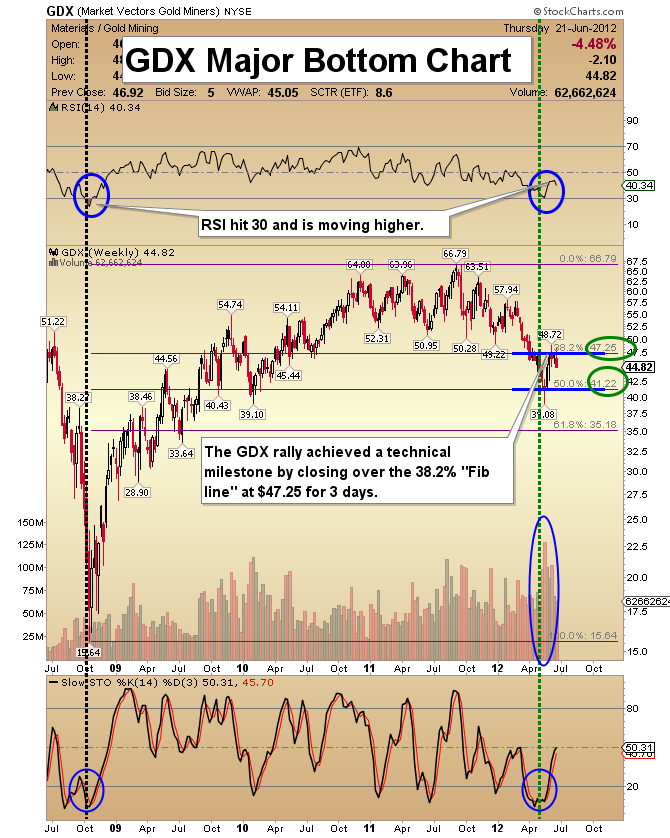
Senior gold stocks are arguably now leading the precious metals sector. GDX is doing battle at the important Fibonacci 38% bull market retracement level. The number I have been watching closely is $47.25.
As of today, we have now had three closes above that level. The “three day close” is an event which confirms technical strength. My work targets $53.50-$55.
A move above $48.50, if it comes on strong volume, would be further confirmation of a new bull phase.
 Fascinating New Graph Shows the 'Economic History of the World Since Jesus'