


Silver Set To Soar Against Everything?
January 24, 2012
Analysis
Sentiment analysis is the art of gauging the herd mentality. When an investment becomes overcrowded, it’s an area to avoid.
The dollar continues to be over-bought and over-loved by a herd of investors who seek a safe haven from the financial crisis. From a technical standpoint, the currency itself is due for a major sell-off this year, and that is likely to launch gold and silver dramatically higher.
The numbers from the COT report continue to be astonishing. The smart money commercials are holding fewer dollars than at any time in the last 14 years, while the speculative herd continues to buy it at a near record pace.
Over time the commercials usually win these battles. Keep in mind that just because the commercials are placing large bets against the dollar does not mean the dollar must start falling right away. In currency markets you need to have strong convictions and patience.
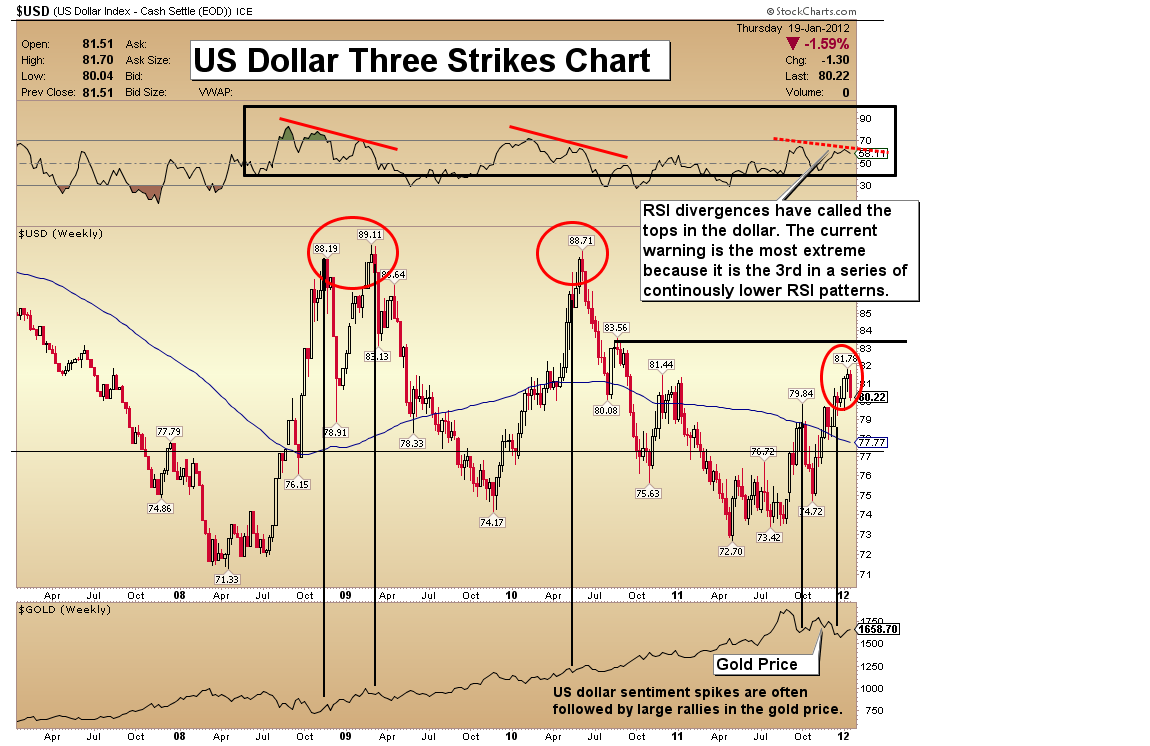
There have been three rallies on the dollar and each rally has been accompanied by weaker action in the RSI indicator. In baseball it is “three strikes and you are out”. For the dollar, it is the 3rd time up to the “rally” bat, and the technical indicators suggest that the outcome for the dollar will be similar to baseball.
I am projecting that the deteriorating technical condition of the dollar will cause a steadily rising gold price into the third quarter of this year, and that will be followed by an even stronger fourth quarter, but a lot depends on how strongly and how soon the dollar begins to decline. A $2300 gold price is highly likely in 2012.
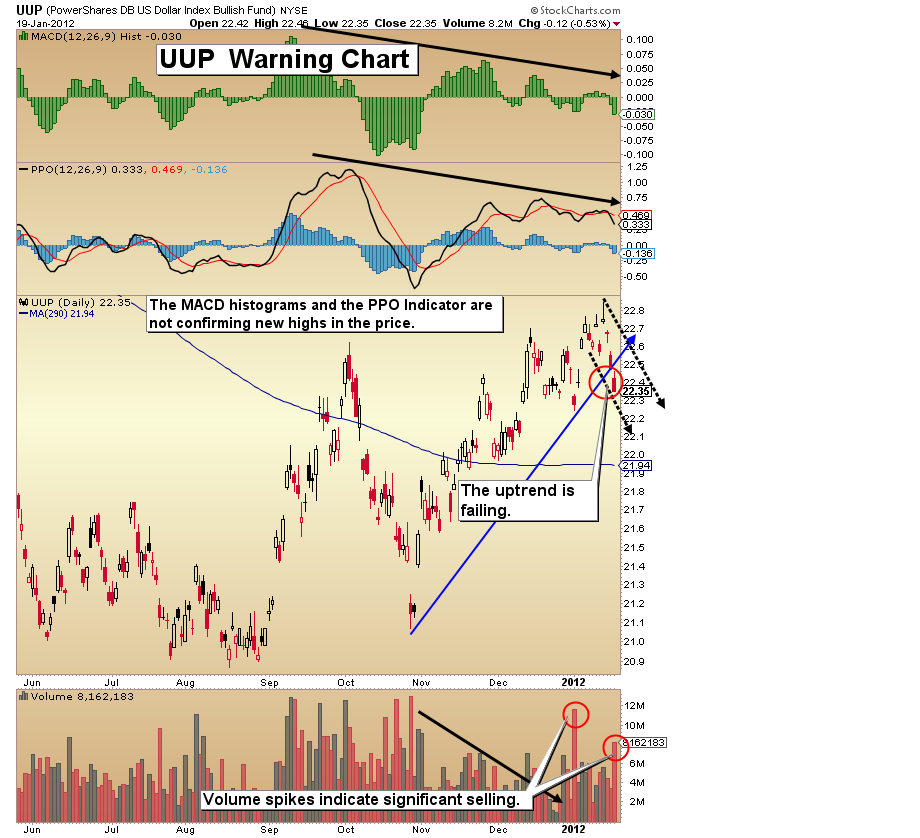
UUP (US Dollar Proxy) Warning Chart
I have included a second chart this week. Here I examine the dollar via the UUP ETF. Technical indicators are warning that the time is near for the end of the current rally in the dollar.
Note the divergences that have occurred at each of the three tops I have highlighted, and note the overall weakening of the RSI over the life of this chart.
Time is running out to secure physical metal for yourself before the next leg down in the dollar commences. Note the black horizontal line on the chart near 83.56. I expect the primary bear trend to resume by that point or even earlier than that.
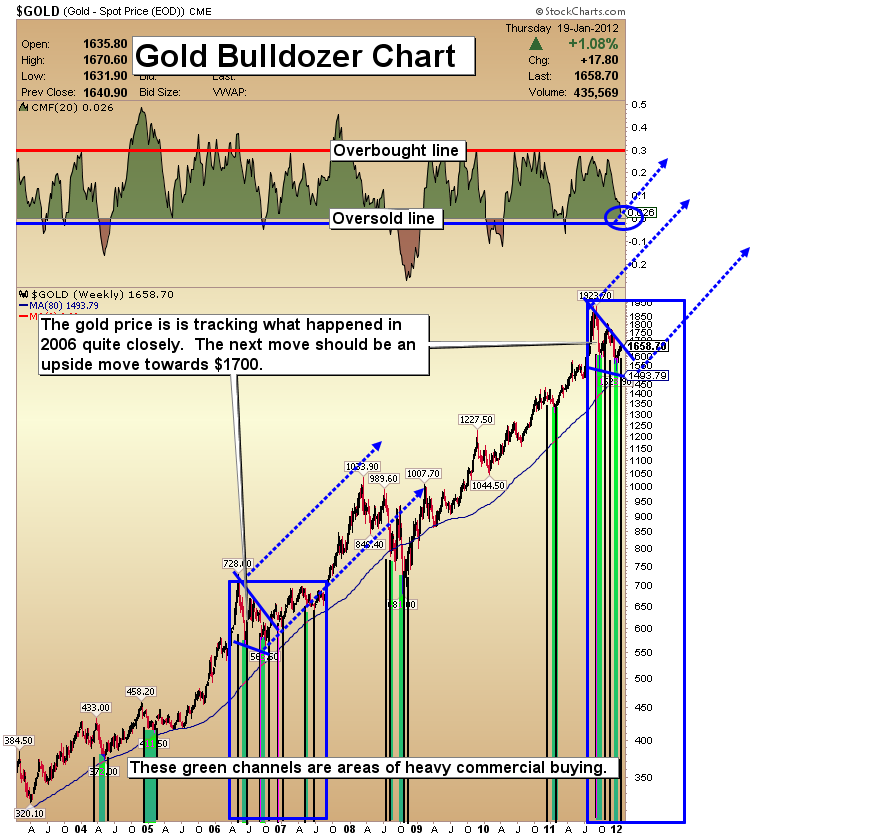
The bearish US dollar set-up above has helped create a number of bullish set-ups for gold. Huge positions of dollars are being held by speculators while the commercials continue to flow their money into gold and silver.
I recommended traders take a little off the table in the $1650 area. Re-buy near $1625. I am operating with a larger focus on long-term positions than short-term swing trades, because the weight of the technical evidence suggests a large move higher is coming.
The $1680 price point likely corresponds roughly with the downtrend line I have highlighted on this chart, and I expect a reaction to around $1625 from there.
 The Deaths of JFK, RFK – and the Silence of the Lambs