


It Is Time To Be More Cautious…
April 9, 2011
Gold and Precious Metals
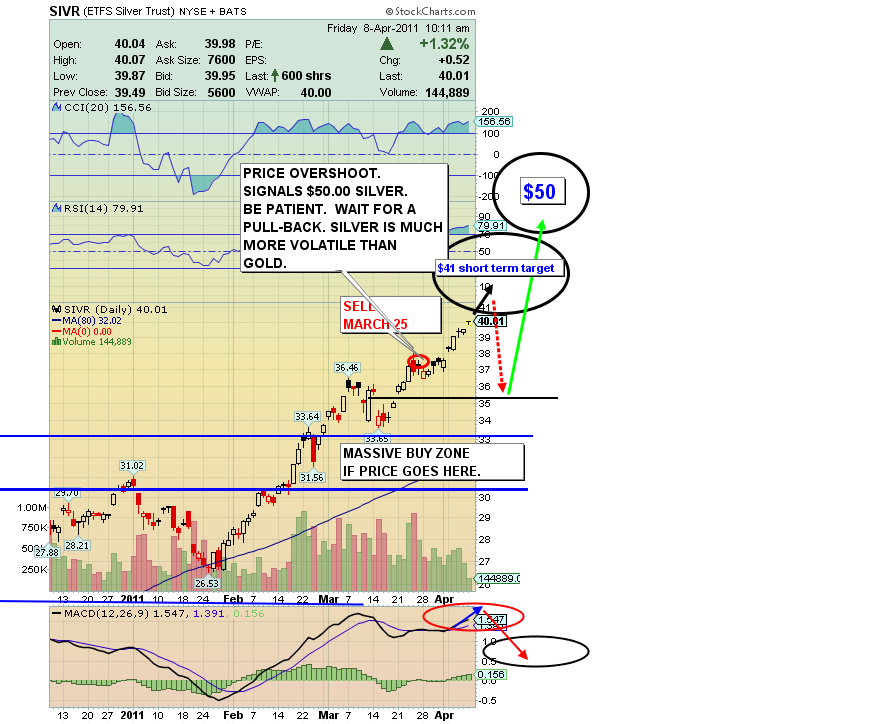
SIVR (silver bullion proxy) Chart
Chart Analysis
It is time to be more cautious in the silver market. My latest profit-taking alert was at $37.32 for SIVR.
We may be entering a dangerous phase where price could shoot $4 or $5 higher very easily, then fall very hard and fast, causing great harm to investors! $50 remains my technical 12 month target for silver, but now is a time to be careful. Some of the smartest money I know is growing more and more cautious about the short term trading situation for silver.
Until further notice, unless you are a wild gambler, I would suggest you allocate 50-80% less capital than normal to SIVR trades. Trading smaller keeps you in the game, as well as safe if there is a big fall. Unlike gold, the corrections in silver can be terrifying if you have too big a position. The key right now is not to sell out, but to trade in much smaller size.
In the biggest picture, owning the physical product is an absolute necessity. I am holding large core physical positions in silver, and those are untouchable, in every sense of the word.
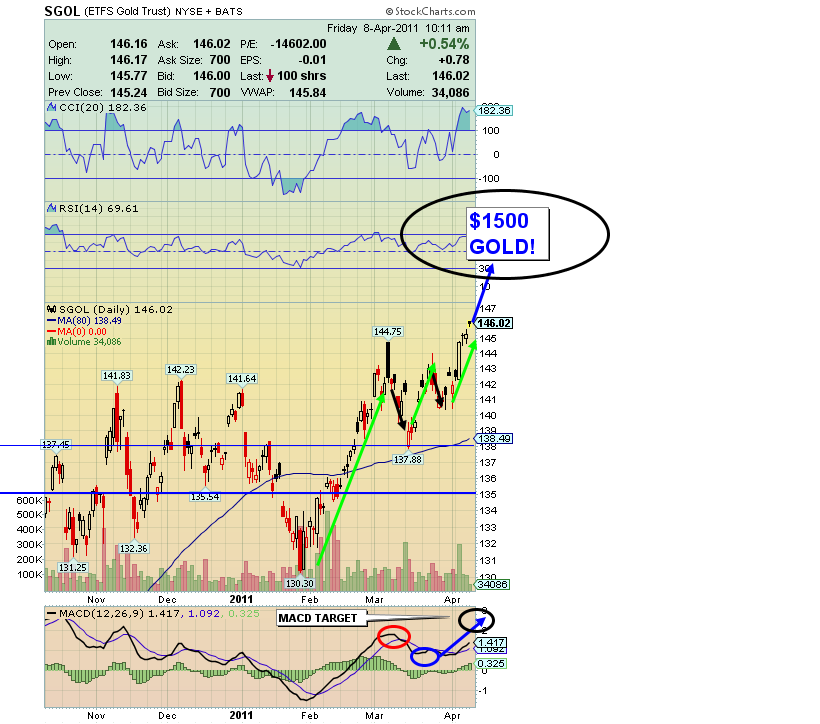
SGOL (gold bullion proxy) 6 Mth Chart
SGOL 6 Month Chart Analysis
This week saw gold achieve a significant breakout above $1440. Gold has been lagging silver in the short term and I would urge you to focus your trading on gold for now, rather than silver. Congratulations to all of you who have held your gold market positions tightly through 6 months of disappointment. It’s not easy to go against market psychology, but rewards are big when you do!
I said a week ago, “This huge precious metal bull market is now greeted with heavy skepticism….There are too many doubters, and that spells higher prices.” This move is the canary in the US dollar coal mine. The US dollar, technically, could be about to shock us all and go into free-fall. The stock market just underwent a fast 15% correction. That caused no visible damage to the global economy. A 15% correction in the dollar, which I am fairly certain is the minimum decline coming, may not be so kind to the world’s major economies.
Backwardation. What gold backwardation mean for the dollar? The known amount of gold in the world is approximately $13-14 trillion, and possibly quite a bit less. That is miniscule in comparison to worldwide debt. The gold market is showing signs of coiling like a cobra, preparing to strike higher! It boils down to this mantra: get the physical metal, not just a paper contract!
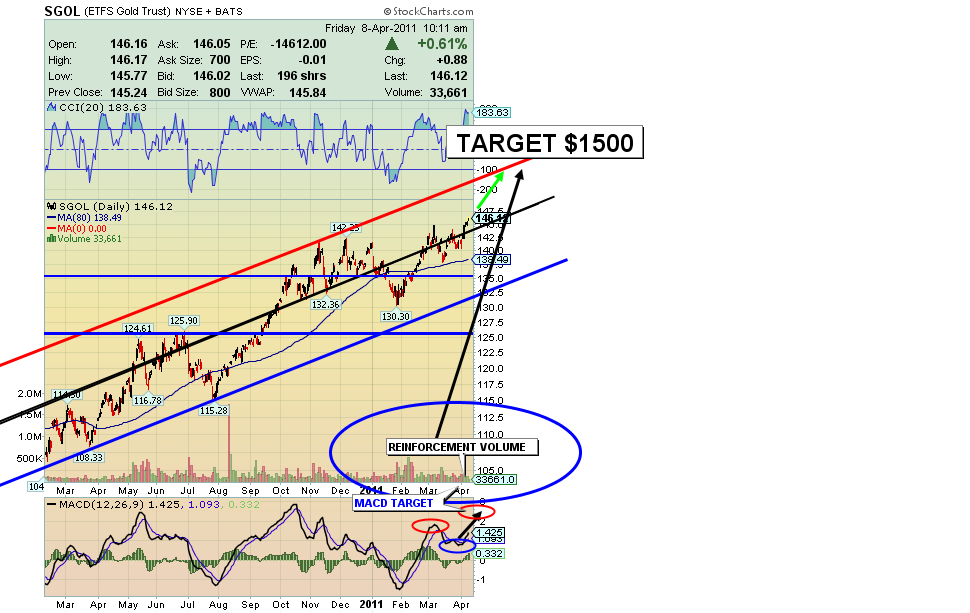
My trading system remains on a buy for gold. Note on the SGOL 14 month chart my “Reinforcement Volume Indicator”, which is suggesting that my $1500 gold target is about to be reached. The volume here on the breakout is suggesting higher prices. I will set new year-end targets if $1500 is reached.
 Will the Tea Party be a Casualty in the Looming Budget Battles?