


![]() Never mind. The Fed simply doubled-down. Instead of expanding its balance sheet by 50%, as happened during the eight years between 2000 and 2008, it went into monetary warp drive, ballooning its made-from-thin-air liabilities by 5X in only six years. Yet even after Friday’s ballyhooed jobs report there were three million fewer full-time breadwinner jobs in November 2014 than there were in the early 2000s.
Never mind. The Fed simply doubled-down. Instead of expanding its balance sheet by 50%, as happened during the eight years between 2000 and 2008, it went into monetary warp drive, ballooning its made-from-thin-air liabilities by 5X in only six years. Yet even after Friday’s ballyhooed jobs report there were three million fewer full-time breadwinner jobs in November 2014 than there were in the early 2000s.

Breadwinner Economy – Click to enlarge
That’s right. Two cycles of lunatic monetary expansion and what they have to show for it is two short-lived bursts of part-time job creation that vanish when the underlying financial bubble bursts.
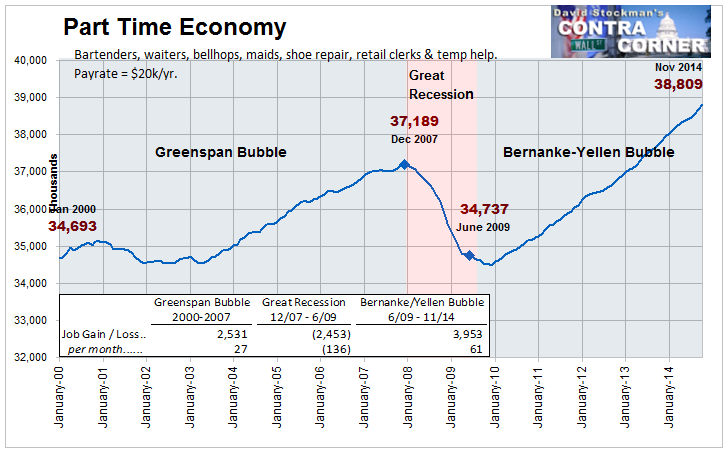
Part Time Economy – Click to enlarge
So, yes, our monetary central planners forget nothing. It doesn’t matter what the actual results have been. Like the original Bourbons, the small posse of unelected academics and policy apparatchiks which control the nation’s all-powerful central bank most surely
 Flash Boys
Best Price: $1.17
Buy New $5.79
(as of 11:15 UTC - Details)
Flash Boys
Best Price: $1.17
Buy New $5.79
(as of 11:15 UTC - Details)
 believe they have a divine right to run the printing presses as they see fit—even if it accomplishes nothing for the 99% of Americans who don’t have family offices or tickets to the hedge fund casino.
Still, you would think that the purported “labor economist” who is now chair person of the joint would be at least troubled by the chart below. Even liberals like Yellen usually do acknowledge that that the chief virtue of the state is that it purportedly generates “public goods” that contribute to societal welfare—-not that it is a fount of productivity and new wealth generation. For that you need private enterprise and business driven efficiency.
Well, then. How do our monetary bourbons explain that the gain in labor hours utilized by the non-farm business sector has been zero since the third quarter of 1999? That is, nada, nichts, nothing, zip for the last 15 years!
![]()
The Fed forgets nothing because its involved in ritual incantation—-that is to say, the execution of religious doctrine. That’s why its pompous devotion to the “incoming data” is such a farce. There is nothing empirical and factually rigorous about what it does; it just changes the doctrinal spin as the bubble expands and the economic data grind-out transient noise one month or quarter at a time.
 Dark Pools: The Rise o...
Best Price: $6.32
Buy New $11.74
(as of 06:25 UTC - Details)
Dark Pools: The Rise o...
Best Price: $6.32
Buy New $11.74
(as of 06:25 UTC - Details)
Even now that the official unemployment rate has occupied the 5-6% zone for several months, the FOMC simultaneously brags about its success in rejuvenating the economy while keeping its foot on the accelerator of “extraordinary” monetary stimulus.
As to the “success” part of the incantation, surely any one who spends even a few hours with the BLS’ U-3 unemployment rate knows it is not worth the paper it is printed on owing to the huge dislocation of the labor force participation rate. That is, the denominator is cooked and the resulting ratio is phony.
And forget about the baby boom retirement excuse. The chart below shows the employment rate for the civilian population 16-54 years old. It has crashed during the last two decades of egregious money printing. Specifically, the 16-54 age population has grown by 37 million since 2000, but the number of non-farm employees in that same working age bracket has grown by just 4 million. Yes, the Fed’s hyper-stimulated economy has generated jobs for just 10% of the prime age workers who have been added to the labor force.
Only a choir of doctrinal chanters would call that “success”.

On the other hand, the policy most surely has been “extraordinary”. We are now in the 72nd straight month of ZIRP, and there is absolutely nothing like that in the economic history of the planet. And this freakish spell of ZIRP is not even remotely attributable
 Against the State: An ...
Best Price: $5.02
Buy New $5.52
(as of 11:35 UTC - Details)
to some unprecedented ailment of the private economy, such as “deflation”. Zero money market rates have been manufactured lock, stock and barrel in the Eccles building.
Against the State: An ...
Best Price: $5.02
Buy New $5.52
(as of 11:35 UTC - Details)
to some unprecedented ailment of the private economy, such as “deflation”. Zero money market rates have been manufactured lock, stock and barrel in the Eccles building.
Yet zero cost roll-over money accomplishes nothing constructive because if growth and wealth could be generated by free money we should have had it for the last 100 years, not just seven. The people who ran this country prior to the current monetary regime were not so stupid as to have overlooked a genuine economic elixir; nor were they so fatuous as to think that by hitting the “print” lever over and over and over that the hard work of production, labor, enterprise and growth could actually be accomplished without human effort.
So, too, our monetary bourbons learn nothing. ZIRP, QE, wealth effects, stock market puts and all the rest of the Fed’s toolkit of financial market repression and manipulation have one principle effect: they generate unnatural, unsustainable and unconscionable financial bubbles.
Yet the Eccles Building once again sees no bubbles when they are again palpable throughout the financial system. Consider the forgotten lessons of last time around. Right up until the 11th hour, the Fed and all its spokesman and magicians denied the possibility of a housing bubble. Bernanke famously said that it was “contained” as late as March 2007. And contrary to the fibs of her apologists, Yellen was sitting right there cautioning against monetary sobriety even as the following chart relentlessly unfolded.
 Broken Markets: How Hi...
Best Price: $7.44
Buy New $24.98
(as of 05:40 UTC - Details)
Broken Markets: How Hi...
Best Price: $7.44
Buy New $24.98
(as of 05:40 UTC - Details)
There you see a parabolic rise if there ever was one. In fact, housing prices rose for 111 consecutive months between 1994 and 2007. Average home prices more than doubled during that interval.
But that spectacular surge self-evidently had nothing to do with the economics of scarcity. Anyone half awake could have determined that lumber prices and building materials did not rise by even a small fraction of that 2X gain during the housing boom, nor did construction wages, real estate brokerage commissions or any other factor of production.
Nope. At bottom, the leading edge of the housing mania was the implicit price of land. That’s what always get bid up to irrational heights when the central bank fiddles with free market pricing of capital and debt.
![]()
Even as land prices were being driven to irrational heights you didn’t need to spend night and day in arcane data dumps to document it. All you had to do was look at the stock price of the homebuilders.
As I documented in The Great Deformation, the combined market cap of the big six national homebuilders including DH Horton, Lennar, Hovnanian, Pulte, Toll Brothers and KBH Homes soared from $6.5 billion in 2000 to $65 billion by the 2005-2006 peak. Yet you only needed peruse the financial statements and disclosures of any of these high-flyers and one thing was screamingly
 The Secret Club That R...
Best Price: $2.23
Buy New $16.87
(as of 09:55 UTC - Details)
evident. They weren’t homebuilders at all; they were land banks that did not own a single hammer or saw or employ a single carpenter or electrician.
The Secret Club That R...
Best Price: $2.23
Buy New $16.87
(as of 09:55 UTC - Details)
evident. They weren’t homebuilders at all; they were land banks that did not own a single hammer or saw or employ a single carpenter or electrician.
Stated differently, the homebuilders’ soaring profits were nothing more than speculative gain on their land banks—gains driven by the cheap mortgage mania that had been unleashed by Greenspan when he slashed the so-called policy rate from 6% to 1% in hardly 30 months of foot-to-the-floor monetary acceleration between 2001 and 2004.
Indeed, that cluelessness amounted to willful negligence. DH Horton was the monster of the homebuilder midway—–a giant bucket shop that never built a single home, but did accumulate land and sell finished turnkey units by the tens of thousands each period. Did it not therefore occur to the monetary politburo that DH Horton had possibly not really generated a 11X gain in sustainable economic profits in hardly 5 years?

So now we come to the current screaming evidence of bubble finance—–the fact that upwards of $500 billion of junk bonds ($200B) and leveraged loans ($300 B) have surged into the US energy sector over the past decades—–and much of it into the shale oil and gas patch.
 The Great Deformation:...
Best Price: $2.00
Buy New $9.95
(as of 09:55 UTC - Details)
The Great Deformation:...
Best Price: $2.00
Buy New $9.95
(as of 09:55 UTC - Details)
Folks, you don’t have to know whether the breakeven for wells drilled in the Eagleville Condy portion of the great Eagle Ford shale play is $80.28 per barrel, as one recent analysis documents, or $55 if you don’t count all the so-called “sunk costs” such as acreage leases and oilfield infrastructure. The point is, an honest free market would have never delivered up even $50 billion of leveraged capital—let alone $500 billion— at less than 400bps over risk-free treasuries to wildly speculative ventures like shale oil extraction.
The fact is, few North American shale oil fields make money below $55/barrel WTI on a full cycle basis (lease cost, taxes, overhead, transport, lifting cost etc.). As shown below, that actually amounts to up to $10 less on a netback to the wellhead basis—–the calculation that drives return on drillings costs.

In short, as the oil market price takes its next leg down into the $50s/bbl. bracket, much of the fracking patch will become a losing proposition. Moreover, given the faltering state of the global economy and the huge overhang of excess supply, it is likely that the current crude oil crash will be more like 1986, which was long-lasting, than 2008-09, which was artificially resuscitated by the raging money printers at the world’s central banks.
So why is there a shale patch depression in store? Because there is literally a no more toxic combination than the high fixed costs of fracked oil wells, which produce 90% of their lifetime output in less than two years, and the massive range of short-run uncertainty that applies to the selling price of the world’s most important commodity.
Surely, it doesn’t need restating, but here is the price path for crude oil over the past 100 months. That is to say, it went from $40 per barrel to $150, back to $40, up to $115 and now back to barely $60 in what is an exceedingly short time horizon.
![]()
Obviously, what we have here is another massive deformation of capital markets and the related flow of economic activity. The so-called “shale miracle” was not made in Houston with some technology help from Silicon Valley. The technology of horizontal drilling and well fracking with chemicals has been around for decades. What changed were the economics, and those were made in the Eccles Building with some help from Wall Street.
As to the latter, was it not made clear by Wall Street’s mortgage CDO meth labs last time that when the central bank engages in deep and sustained financial repression that it produces a stampede for “yield” which is not warranted by any sensible relationship between risk and return? It should not have been even possible to sell a shale junk bond or CLO that was based on assets with an effective two year life, a revenue stream subject to wild commodity price swings and one thing even more unaccountable. Namely, that the enterprise viability of virtually every shale junk issuer has always been dependent upon an endless rise in the junk bond issuance cycle.
Stated differently, oil and gas shale E&P operators are drastic capital consumption machines. Due to the lightening fast decline rates of shale wells, firms must access more and more capital just to run in place. If they don’t flush money down the well bore, they die along with all the “sunk” capital that was previously put in place.
In the case of shale oil, for example, it is estimated that were drilling to stop for just one month, production in the Eagle Ford, Bakken and one or two other major provinces would drop by 250,000 barrels per day. After four months, the drop would be 1 million bbl./day and after a one-year, nearly half the current four million barrels of shale oil production would disappear.
That’s why all of a sudden there is so much strum and drang about “breakeven” pricing. Obviously, new drilling is not going to go to zero under any imaginable price scenario, but for all practical purposes the shale revolution could shut down just as fast as did the housing boom in 2006-2007. In effect, the shale financing boom presumed that both the junk bond cycle and the oil price cycle had been eliminated.
Needless to say, they have not. So the impending “correction” may well be as swift and violent as was the housing bust.
![]()
Indeed, in the short-run the shale crash could be worse. The fantastic, debt-fueled drilling spree of the past 5-years is now sunk and will produce rising levels of production for a few quarters until rig activity is sharply curtailed and some of the better capitalized operators stop drilling in order to avoid lease expiration writeoffs.
So as the WTI market price is driven toward $50/ barrel, recall that the netback to the producer is significantly less. In the case of the biggest shale oil province, the Bakken, the netback to the well-head is upwards of $11 below WTI. Accordingly, cash flow will plunge and that source of drilling funds will evaporate with it.
But the big down-leg is coming in the junk market. This time around, Wall Street has been even more reckless in its underwriting than it was with toxic securitized mortgages. Barely six months ago it sold $900 million of junk bonds for CCC rated Rice Energy. The latter operates in the Marcellus gas shale trend but that makes the story even more preposterous.
These bonds were sold at barely 400 bp over the 10-years treasury, and the issue was 4X oversubscribed. That is, there was upwards of $4 billion of demand for the bottom of the barrel securities of a shale speculator that had generated the following results during its 15 quarters as a public filer with the SEC. To wit, it had produced $100 million of cumulative operating cash flow versus $1.2 billion of CapEx. In short, if the junk bond market dies, Rice Energy is a goner soon thereafter.
Indeed, the case of Forest Oil, one of the early pioneers in the giant Eagle Ford play shows what happens when new funding dries up. Owing to the dearth of capital, this once high flier has now done an HR Horton and then some—having lost 99% of its peak market cap.
Here’s the thing, however. Rice Energy is not an outlier. It is a poster child for the entire junk shale Ponzi. Take the storied leader of the pack—— Continental Resources (CLR). Its principal owner and flamboyant oil patch entrepreneur, Harold Hamm, did brilliantly assess the North Dakota opportunity once it became clear that the central banks of the world were not going to tolerate the $40 oil plunge after the financial crisis.
Yet absent the massive outbreak of junk debt financing, he would not have had the billions for his divorce settlement or the $15 billion his stock is still worth after the 40% crash of oil prices and 60% plunge of CLR stock since mid-year. The fact is, during the last 9 years, CLR has generated $8 billion of operating cash flow compared to $14 billion of CapEx—most of it poured into the Bakken.
The wonders of cheap debt. CLR had $140 million of debt back in 2005 when the shale boom was in its infancy. It now has 43X more or about $6 billion, and the bleeding is just getting underway.
Needless to say, the issue is not whether Harold Hamm can hold on to his billions. Instead, the question is whether the bourbons in the Eccles Building can possibly hold on to their credibility for another go-round.
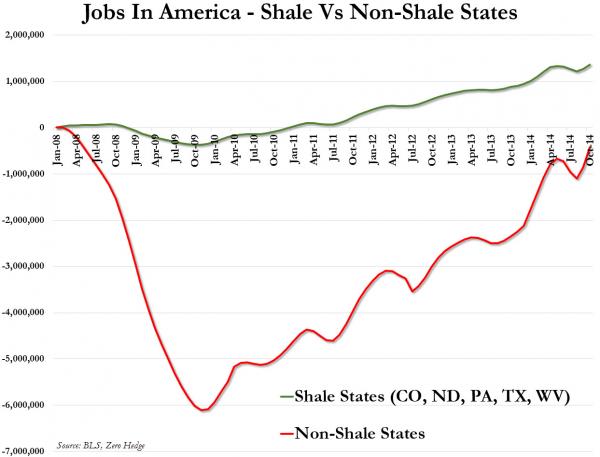
As the global boom cools, oil demand withers, the junk market craters, and the shale patch tumbles into depression, someone might actually note the chart below.
Its been another central bank parlor trick. The job count in the 45 non-shale states last Friday was 400,000 lower than it was at the end of 2007. That’s right, not one new job—even part-time or in the HES complex—- for the last seven years.
All the new jobs have been in the 5 shale states. That is, they were manufactured by the Fed’s tidal wave of cheap capital and the central bank fueled global recovery which created the illusion that $100 oil was here to stay.
But it isn’t and neither is the shale boom, the shale jobs or the shale investment spike, which counts for a good share of overall CapEx growth since the crisis.
Yes, indeed. The monetary politburo did it again.
Reprinted with permission from David Stockman’s Corner.

