Our entire economy is characterized by cartel rentier skims, central-bank goosed asset bubbles and stagnating earned income for the bottom 90%.
Despite the rah-rah about the “ownership society” and the best economy ever, the sobering reality is very few Americans are able to get ahead, i.e. build real financial security via meaningful, secure assets which can be passed on to their children.
As I’ve often discussed here, only the top 10% of American households are getting ahead in both income and wealth, and most of the gains of these 12 million households are concentrated in the top 1% (1.2 million households). (see wealth chart below).
Why are so few Americans able to get ahead? there are three core reasons:
1. Earnings (wages and salaries) have not kept up with the rising cost of living.
2. The gains have flowed to capital, which is mostly owned by the top 10%, rather than to labor ((wages and salaries).
 Get a Job, Build a Rea...
Buy New $6.95
(as of 04:50 UTC - Details)
Get a Job, Build a Rea...
Buy New $6.95
(as of 04:50 UTC - Details)

3. Our financialized economy incentivizes cartels and other rentier skims, i.e. structures that raise costs but don’t provide any additional value for the additional costs.
It’s instructive to compare today’s household with households a few generations ago. As recently as the early 1970s, 45 years ago, it was still possible for a single fulltime-earner to support the household and buy a home, which in 1973 cost around $30,000 (median house price, as per the St. Louis FRED database).
As recently as 20 years ago, in 1998, the median house price in the U.S. was about $150,000— still within reach of many two-earner households, even those with average jobs.
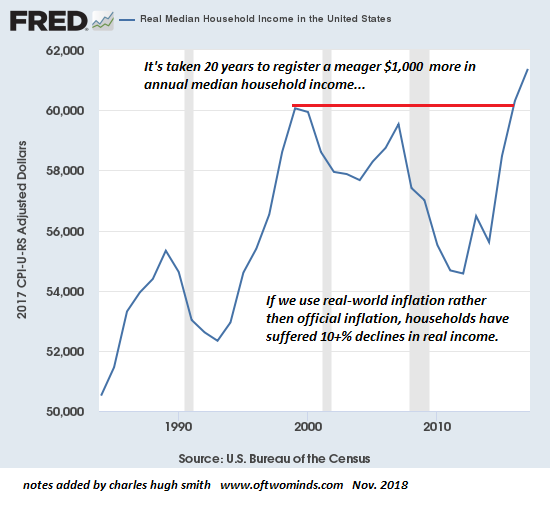
As the chart below shows, real median household income has only recently exceeded the 1998 level— and only by a meager $1,000 annually. If we use real-world inflation rather than the under-estimated official inflation, real income has plummeted by 10% or more in the past 20 years.
This reality is reflected in a new study of wages in Silicon Valley, which we might assume would keep up due to the higher value of the region’s output.The study found the wages of the bottom 90% declined when adjusted for inflation by as much as 14% over the past 20 years:
“The just-released report showed that wages for 90 percent of Silicon Valley workers (all levels of workers except for the top 10 percent)are lower now than they were 20 years ago, after adjusting for inflation. That’s in stark contrast to the 74 percent increase in overall per capita economic output in the Valley from 2001 to 2017.”
source: Why Silicon Valley Income Inequality Is Just a Preview of What’s to Come for the Rest of the U.S.
Meanwhile, the median house price has more than doubled to $325,000 while median household income has stagnated. Please note this price is not adjusted for inflation, like the median income chart. But if we take nominal household income in 1998 (around $40,000 annually) and compare it to nominal household income now in 2018 (around $60,000), that’s a 50% increase–far below the more than doubling of house prices.