


If any evidence was needed that the market is dying at the zero bound, it came in yesterday’s violent 15-minute rip when the algos read the Fed’s release to mean there will be no rate hike in June. It put you in mind of monetary rigor mortis——the last spasm of something that’s already dead but doesn’t known it.
Certainly the sell-side talking heads are clueless in their utterly mendacious patter that there is no bubble in stocks. Why, valuations are are in-line with historic multiples, we are told, and, besides, the Fed will keep interest rates low for long.
That kind of assurance is at once fatuous and reckless. With the earliest possible “lift-off” date now moved to September, money market interest rates will have been pinned to the zero bound for 81 months running. Do these lemmings actually think this can go on much longer—-to say 90 or 100 months—- without signaling a complete capitulation of the Fed to the robo-traders?
 Tower of Basel: The Sh...
Best Price: $11.05
Buy New $10.76
(as of 05:55 UTC - Details)
Tower of Basel: The Sh...
Best Price: $11.05
Buy New $10.76
(as of 05:55 UTC - Details)

Likewise, have they failed to note that the casino is saturated with trillions of carry-trades which will begin to unwind once interest rate normalization commences?
When have speculators ever retreated in an orderly manner, and, most especially, why is the current even greater financial bubble going to deflate any less violently than did the dotcom in 2000 and the housing/Wall Street bubble in 2008?
That is, after years of buying with borrowed money, repo or options, Wall Street gamblers will soon be forced to sell in order to liquidate positions that will become increasingly unprofitable as interest rates rise. Indeed, negative carry as far as the eye can see is now a virtual certainty.
Besides that, why would any rational investor roll the dice until the very last minute when valuations are already sky high, and therefore extremely vulnerable to a drastic downward re-
 Flash Boys
Best Price: $1.17
Buy New $5.79
(as of 11:15 UTC - Details)
rating? According to the Wall Street Journal’s latest calculations, the LTM reported earnings of the S&P 500 companies were $99/share.
Flash Boys
Best Price: $1.17
Buy New $5.79
(as of 11:15 UTC - Details)
rating? According to the Wall Street Journal’s latest calculations, the LTM reported earnings of the S&P 500 companies were $99/share.
That’s notable because: 1) its down 6% from the LTM peak of $106 reported in the September 2014 quarter; 2) unlike the “ex-items” hokum peddled by the street, it’s an honest measure of earnings because the GAAP accounting is certified to the SEC by corporate executives on penalty of jail; and 3) its means that the PE multiple on today closing price is about 21.5X, thereby occupying the nosebleed section of recorded history.
And that’s not the half of it. Just as you can drown in a river with an average depth of two feet, average PE multiples can also obscure the deep eddy currents hidden in the popular stock indices.
That’s why the chart below is dispositive. Unlike the usual sell-side fare, it examines the median PE multiple, not the weighted average, for the thousands of stocks listed on the NYSE. In a word, the valuation level has never been higher since 1950; and the 21X shown in the chart is actually nearly 23X based on 10% market gain since June 2014.

And this gets to the crux of the matter. Even if the argument that PE multiples are in line with history were true, which it most definitely is not, the point is still bogus. That’s because capitalization rates on corporate earnings should be going down, not up, in a world in which sustainable trend-line growth has virtually disappeared; where profit margins are at off-the charts historic highs and heading for a reversion to the mean; and where interest rates can only trend upward on a secular basis after an unprecedented, nay historically freakish, 35 years of deflation.
 Dark Pools: The Rise o...
Best Price: $6.32
Buy New $11.74
(as of 06:25 UTC - Details)
Dark Pools: The Rise o...
Best Price: $6.32
Buy New $11.74
(as of 06:25 UTC - Details)
And notwithstanding all of the recent arm-waving about the need for double-pumping the seasonal adjustments of the punk GDP results for Q1, the trend performance of the macro fundamentals is just plain terrible. For instance, the growth rate of real final sales during the seven years since the pre-crisis peak has been an anemic 1.1%. That compares to 2.5% during the post-2000 seven-year cycle, and 3.5% during the half century after 1950.
Sooner or later you can’t squeeze more profits from a stone cold economy.So why should earnings be valued at an all time high when the US economy is now growing at just one-third of its historic rate?
 Broken Markets: How Hi...
Best Price: $7.44
Buy New $24.98
(as of 05:40 UTC - Details)
Likewise, on the eve of the crisis in December 2007, the BLS reported 138.4 million payroll jobs. Last month the number was just 141.4 million, meaning that only 3 million net jobs have been created over the last 88 months. Again, that compares to 6 million new jobs in the comparable period after the 2000 peak and 13 million in the seven years after 1990.
Broken Markets: How Hi...
Best Price: $7.44
Buy New $24.98
(as of 05:40 UTC - Details)
Likewise, on the eve of the crisis in December 2007, the BLS reported 138.4 million payroll jobs. Last month the number was just 141.4 million, meaning that only 3 million net jobs have been created over the last 88 months. Again, that compares to 6 million new jobs in the comparable period after the 2000 peak and 13 million in the seven years after 1990.
Moreover, not only is the job growth rate deflating faster than Tom Brady’s football—–that is to 34,000 per month in the current so-called recovery cycle compared to 70,000 and 155,000 per month in the previous two cycles, respectively—-but the compositional quality has been heading south even faster.
To wit, the US economy has actually shed 2 million full-time, higher paying “breadwinner” since December 2007—-down from 72 million to just 70 million in the April report. Accordingly, the net 3 million gain in the total payroll count is entirely attributable to a 2 million pickup in the part time economy—restaurant’s, bars, retail and personal services—-and a 3 million gain in the fiscally dependent HES Complex (health, education and social services).
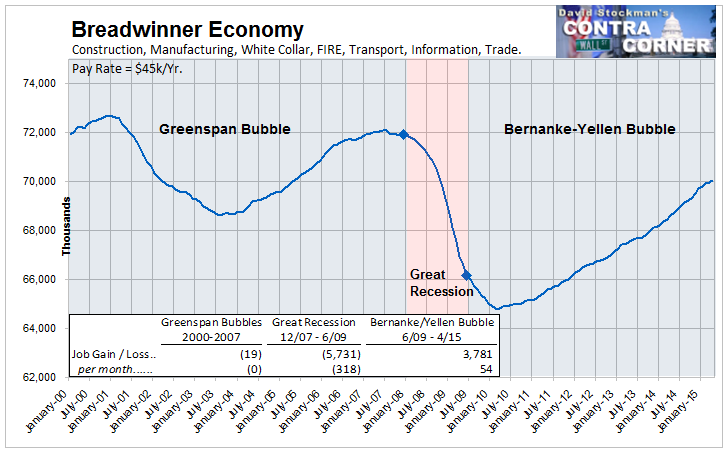
Breadwinner Economy Jobs – Click to enlarge
Nor are nosebleed PE multiples compatible with the feeble trend of investment in real plant and equipment. The gross rate of investment since the pre-crisis peak is less than 1% per annum; and the net rate, after depreciation, is still 20% below its 1999 level!
So there is one thing alone which is keeping the market levitated at today’s egregiously inflated levels. Namely, the Fed induced spasms of the few remaining robo-machines in the casino that have not yet been unplugged. At the moment, they continue to chop away on life support each time the Fed cops out for still one more meeting.
 The Great Deformation:...
Best Price: $2.00
Buy New $9.95
(as of 09:55 UTC - Details)
The Great Deformation:...
Best Price: $2.00
Buy New $9.95
(as of 09:55 UTC - Details)
At length, however, even the monetary politburo will run out of excuses and deceptions. When the juice stops and the last machines go quiet, of course, there will be pandemonium in the casino, and here’s why.
The Great Financial Bubble dying at the zero bound has been inflating with just three interruptions——1987, 2000 and 2008-09—for the last 33 years. As a result, the market value of stocks, bonds and other debts have simply become decoupled from national income.
At 2X GDP in 1981, the financial market was valued at its multi-decade trend level. Since then, the market value of corporate equities has risen 17X and debt outstanding is up by 20X.
Accordingly, financial markets today are capitalized at 5X national income. That’s an elephantine bubble by any other name. And that’s why market spasms like yesterday’s 15-minute rip do indeed signify that monetary rigor mortis is rapidly setting in.
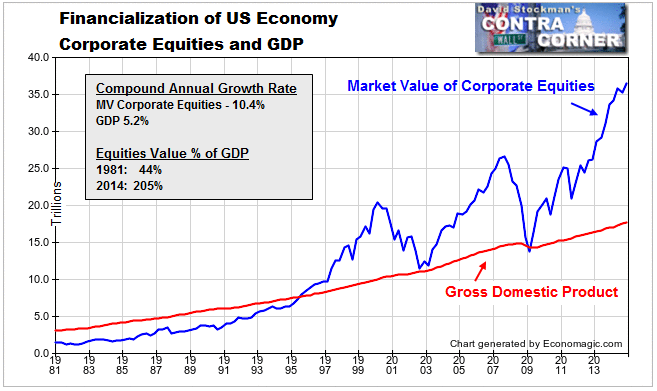
Corporate Equities and GDP – Click to enlarge
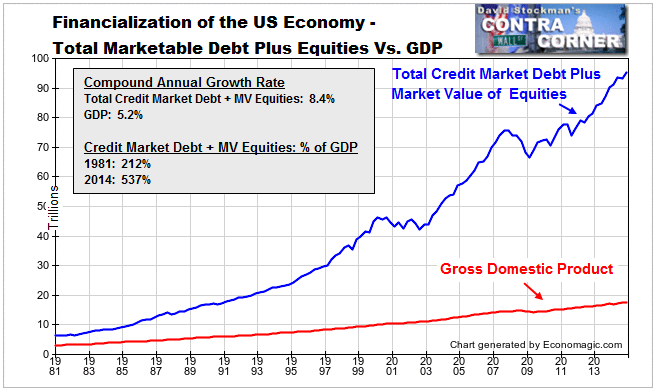
Total Marketable Securities and GDP – Click to enlarge
Reprinted with permission from David Stockman’s Corner.

