


Let’s see. Between July 2007 and January 2009, the median US residential housing price plunged from $230k to $165k or by 30%. That must have been some kind of super “tax cut”.
In fact, that brutal housing price plunge amounted to a $400 billion per year “savings” at the $1.5 trillion per year run-rate of residential housing turnover. So with all that extra money in their pockets consumers were positioned to spend-up a storm on shoes, shirts and dinners at the Red Lobster.
![]()
Except they didn’t. And, no, it wasn’t because housing is a purported “capital good” or that transactions are largely “financed” at upwards of 85% leverage ratios. None of those truisms changed consumer incomes or spending power per se.
 Where Keynes Went Wron...
Best Price: $2.13
Buy New $8.00
(as of 05:30 UTC - Details)
Where Keynes Went Wron...
Best Price: $2.13
Buy New $8.00
(as of 05:30 UTC - Details)

Instead, what happened was the mortgage credit boom came to a thundering halt as the subprime default rates became visible. This abrupt halt to mortgage credit expansion, in turn, caused the whole chain of artificial economic activity that it had funded to rapidly evaporate.
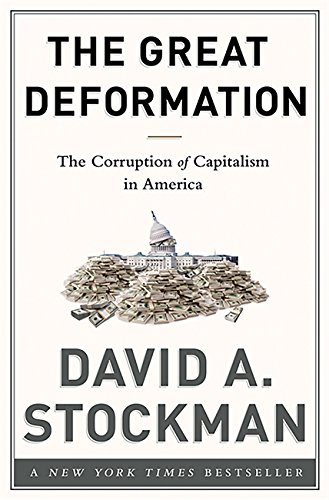
And it was some kind of debt boom. The graph below is for all types of mortgage credit including commercial mortgages, and appropriately so. After all, the out-of-control strip mall construction during that period, for example, was owing to the unsustainable boom in home construction—especially the opening of “new communities” in the sand states by the publicly traded homebuilders trying to prove to Wall Street they were “growth machines”.
Soon Scottsdale AZ and Ft Myers FL were sprouting cookie cutter strip malls to host “new openings” for all the publicly traded specialty retail chains and restaurant concepts—–along with those lined-up in a bulging IPO pipeline. These step-children of the mortgage bubble were also held to be mighty engines of “growth”. Jim Cramer himself said so—-he just forgot to mention what happens when the music stops.
![]()
A similar kind of credit bubble chain materialized in the hospitality segment. As the mortgage debt spiral accelerated, households began tapping their homes ATM machines through a process called cash-out finance or MEW (mortgage equity withdrawal). At the peak of the borrowing frenzy in 2006-2007, the MEW rate was in the order of $500-$800 billion annually. Accordingly, upwards of 10% of household DPI (disposable personal income)
 The Great Deformation:...
Best Price: $2.00
Buy New $9.95
(as of 09:55 UTC - Details)
was accounted for not by rising wages and salaries or even by more generous taxpayer financed transfer payments from Washington.
The Great Deformation:...
Best Price: $2.00
Buy New $9.95
(as of 09:55 UTC - Details)
was accounted for not by rising wages and salaries or even by more generous taxpayer financed transfer payments from Washington.
Actually, it was far easier than that. American families just hit their home ATM cash button , and applied the proceeds to bigger, better and longer vacations, among other things. Soon, hotel and vacation resort “revpar” (revenue per available room) was soaring owing to surging occupancy and higher room rates.
On the margin of course, the incremental demand that sent hotel revpar soaring was derived from mortgage credit confected out of thin air by the financial system. Yet in the short-run is was a strong signal for more investment in hotel rooms and that’s exactly what materialized.
As it happened, of course, the revpar surge was a false signal and the hotel room building spree was a giant malinvestment. Construction spending on new hotels exploded from $10 billion to $40 billion annually during the 70 months after early 2003. Except….except that when the mortgage boom stopped and the frenzied MEW extraction halted, revpar plunged and the hotel room construction boom retraced back below the starting line in barely 20 months.
![]()
 All the Presidentsu201...
Best Price: $4.39
Buy New $44.43
(as of 08:35 UTC - Details)
In all, between Q4 2000 and Q4 2007, US mortgage credit expanded by the staggering sum of $8 trillion. “Staggering” is not hyperbole. The growth of mortgage debt outstanding during that 84 month period exceeded by nearly 20% all of the mortgage debt that existed at the turn of the century. The CAGR for that period was 12% annually or orders of magnitude higher than the sustainable growth capacity of output and incomes. So mortgage credit went from 65% of GDP to 100% in an historical flash.
All the Presidentsu201...
Best Price: $4.39
Buy New $44.43
(as of 08:35 UTC - Details)
In all, between Q4 2000 and Q4 2007, US mortgage credit expanded by the staggering sum of $8 trillion. “Staggering” is not hyperbole. The growth of mortgage debt outstanding during that 84 month period exceeded by nearly 20% all of the mortgage debt that existed at the turn of the century. The CAGR for that period was 12% annually or orders of magnitude higher than the sustainable growth capacity of output and incomes. So mortgage credit went from 65% of GDP to 100% in an historical flash.
The tsunami of mortgage credit exceeded anything previously imaginable by even the most egregious “easy money” populists. But here’s the preposterous part. The monetary politburo watched this tidal wave rising and did not become alarmed in the slightest. Indeed, Greenspan and Bernanke thought MEW was a wonderful tool to goose household spending and thereby justify its spurious belief that a handful of central bankers could deftly guide the $14 trillion US economy to the nirvana of permanent full employment prosperity.
![]()
The above parabolic curve by no means represents the free market at work. For that kind of borrowing explosion to occur without causing interest rates to soar sky-high (and thereby soon choke off the borrowing spree), there would need to have occurred a powerful upsurge in the US savings rate, permitting the market to clear at prevailing interest rates.
 Fascism versus Capitalism
Best Price: $3.39
Buy New $7.45
(as of 05:45 UTC - Details)
Fascism versus Capitalism
Best Price: $3.39
Buy New $7.45
(as of 05:45 UTC - Details)
It does not take much deep historical research to remind that didn’t happen. Not in the slightest. Indeed, the US household savings rate had been sinking ever since the Greenspan money printing regime got off the ground in response to the 25% stock market crash in October 1987. And once the Maestro went all-in opening up the monetary spigots in January 2001, thereby driving money market rates from 6% to 1% during the next 30 months, household savings resumed their tumble into the sub-basement of history.
As shown below, by the peak of the mortgage boom when demand for savings was at high tide, the savings rate had actually vanished, reaching hardly 2.5% of personal income. That compared to pre-Greenspan rates of 10-12.5% (based on current NIPA measurement concepts), meaning that the US economy was parched of savings at the very time it was bursting with new mortgage debt issuance.
Stated differently, the mortgage credit boom exploded uncontrollably in the run-up to the financial crisis because free market pricing of debt and savings had been totally distorted and falsified by the monetary central planners at the Fed. The resulting $8 trillion eruption of mortgage credit, in turn, funded bubble style spending and investment throughout the warp and woof of the US economy—–setting the stage for the subsequent painful liquidation and reversal.
![]()
The housing bubble and bust, in fact, was a dramatic if painful lesson on the danger of central bank generated financial repression. Drastic mispricing of savings and mortgage debt in this instance touched off a cascade of distortions in spending and investment that did immense harm to the main street economy because they induced unsustainable economic bubbles to accompany the financial ones.
The boom and bust of residential construction and the related whip-sawing of employment and supplier industry production is obvious enough. But the violent surge and plunge pictured below is not some unique artifact of a once-in-100-years housing anomaly. Instead, it was a predictable and generalizable effect of central bank driven mispricing of debt and equity capital and the availability of vast gobs of fiat credit.
![]()
The only way to describe the above happening is that it represents the violent liquidation of bubble economics. After doubling between mid-2000 and mid-2006 owing to the home price and mortgage bubble, residential construction spending plunged by 65% during the next 36 months. That was not exactly Bernanke’s “Great Moderation” so insouciantly pronounced in March 2004—hardly 24 months before the above cliff dive commenced.
And its not a matter purely for future study by the Princeton economics department, either. As President Obama would be wont to say, “some folks” got hurt along the way. In fact, nearly 50% of all employees in residential construction at the 2006 peak were out of work a few years after the bust.
![]()
Substitute the term “E&P expense” in the shale patch for “housing” investment and employment in the sand states, and you have tomorrow’s graphs—–that is, the plunging chart points which are latent even now in the crude oil price bust. But the full story of the housing bust also reminds that the long caravans of pick-up trucks which will soon be streaming out of the Bakken in North Dakota will represent only the first round impact.
 Against the State: An ...
Best Price: $5.02
Buy New $5.52
(as of 11:35 UTC - Details)
Against the State: An ...
Best Price: $5.02
Buy New $5.52
(as of 11:35 UTC - Details)
The real problem with central bank financial repression is that it plants financial land-mines in hidden places throughout the financial system and real economy. Indeed, the one thing that the Keynesian money printers are correct about is that a “multiplier” effect is actually operative. That is, the chain of distortions which results from the mispricing of capital and the ballooning of fiat credit multiplies many times over as it cascades through the economic system.
So that is why its important at this juncture to review the Maestro’s favorite chart during the housing boom. During the better part of three years more than one-half trillion dollars per year entered the household spending stream right out of home equity piggybanks. By some estimates the peak rate was nearly $800 billion annualized or, as indicated above, upwards of 10% of total disposable income.
Needless to say, this artificial spending boom washed through the length and breadth of the US economy, generating sales of Coach handbags, pilates equipment, big screen TVs, time-share resort units and countless more that would otherwise not have happened. So when the air came out of the mortgage debt bubble, real PCE dropped for 20 straights months—–unlike anything previously experienced in the post-war era.
But as shown below, that was not due to some mysterious disappearance of Keynesian “aggregate demand”. Consumption spending faltered because America’s home ATM’s went dark.

![]()
Here’s the point. In an honest free market for debt and capital there would have been no MEW eruption in the first place. The incipient boom in mortgage credit would have throttled itself. That is, had the Fed not had its big
 Wall Street, Banks, an...
Best Price: $5.39
Buy New $4.00
(as of 05:45 UTC - Details)
fat thumb on the price of debt, interest rates would have soared, and American households would have been incented to add cash to their nest eggs, not strip mine the equity from their homes.
Wall Street, Banks, an...
Best Price: $5.39
Buy New $4.00
(as of 05:45 UTC - Details)
fat thumb on the price of debt, interest rates would have soared, and American households would have been incented to add cash to their nest eggs, not strip mine the equity from their homes.
And that leads exactly to the next bubble——the energy boom that is now hitting the wall. The trillions of MEW that US households falsely extracted from the inflated equity value of their homes did not stay within the confines of a closed model US economy. Instead, over the decade or so before the financial crisis a goodly portion flowed into demand for shirts, shoes, electronics and other gadgets from Mr. Deng’s export factories in East China.
And during that debt-fueled US consumption boom, interest rates did not remain low because the workers in China’s new sweatshops had an outsized appetite for savings, as per the sophistry spewed out by Greenspan and Bernanke. No, it was the People’s Printing Press of China that had an humongous appetite—–that is, for mercantilist economic growth obtained by pegging their exchange rates at artificially low levels in order to keep their export factories booming.
So countering the Fed’s fat thumb on the domestic cost of debt in the US, the PBOC keep its thumb on the RMB exchange rate, thereby flooding its domestic economy with the most fantastic expansion of credit fueled investment in industrial capacity and internal infrastructure that the world had ever seen. Between 2000 and 2014, China’s credit outstanding soared from $1 trillion to $25 trillion. Consequently, its credit swollen GDP
 Amazon.com $50 Gift Ca...
Buy New $50.00
(as of 11:05 UTC - Details)
expanded from $1 trillion to $9 trillion in a comparative heartbeat; and its crude oil consumption soared from 2 million barrels per day to 8 million.
Amazon.com $50 Gift Ca...
Buy New $50.00
(as of 11:05 UTC - Details)
expanded from $1 trillion to $9 trillion in a comparative heartbeat; and its crude oil consumption soared from 2 million barrels per day to 8 million.
In short, the Fed exported bubble finance to the entire world, but most especially China and the EM. The upshot was an extended era of booming but phony global growth, and a consequent artificially high oil prices at $115 per barrel.
When central bank inflated oil prices were coupled with lunatic junk bond yields in the US shale patch at barely 300 bps over the central bank repressed yield on the US treasury note, the result was the same old bubble thing. Namely, a half trillion dollar flow of high yield bonds and loans to the energy sector, and a wholly artificial explosion of US shale liquids production from 1 million to more than 4 million barrels per day.
Like in the case of the housing bubble, the energy boom was an accident waiting to happen— testimony to another even grander experiment by the madmen running the world’s central banks. It is now exploding right on schedule. The plunging graphs subsequent to the housing bust are now being re-gifted to the energy patch and all the bloated, unstable chains of finance and real economic activity which flow from it.
The graph below which shows that every net job created in the US during the last seven years is attributable to the shale states will be one of the first to morph into a less happy shape.
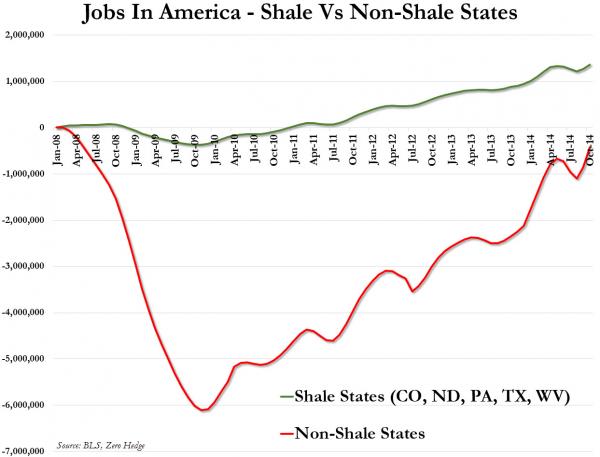
But there is something else even more significant. The global oil price collapse now unfolding is not putting a single dime into the pockets of American households—-the CNBC talking heads to the contrary notwithstanding. What is happening is the vast flood of mispriced debt and capital, which flowed into the energy sector owning to the Fed’s lunatic ZIRP and QE policies, is now rapidly deflating.
That will reduce bubble spending and investment, not add to economic growth. It’s the housing bust all over again.
Reprinted with permission from David Stockman.

