


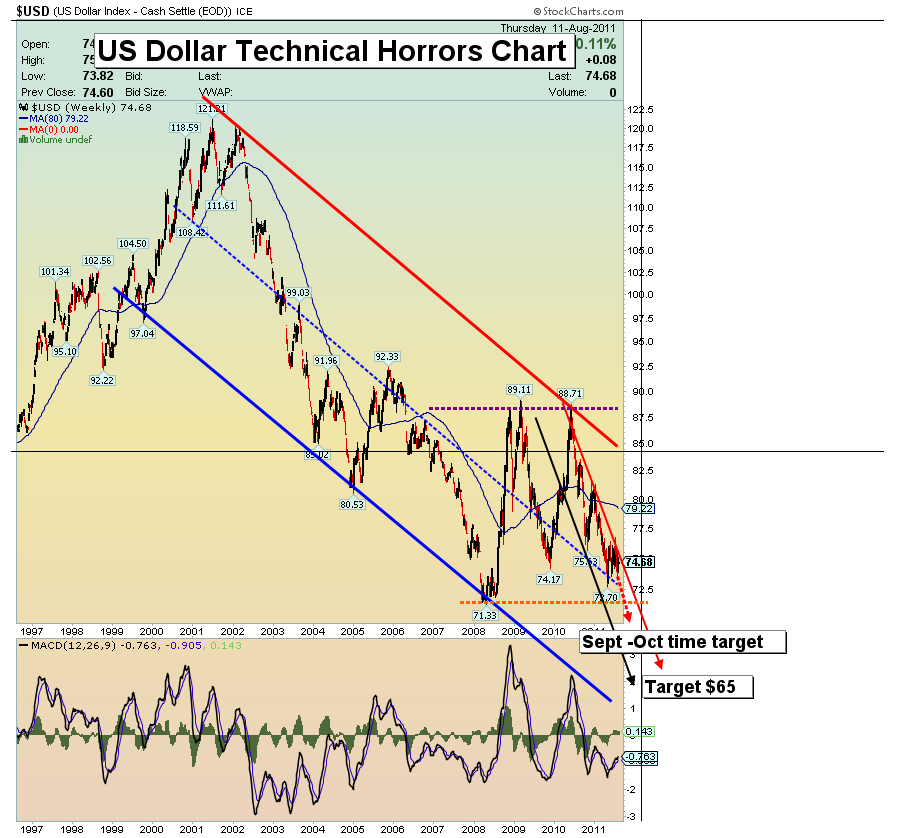
Dollar Commentary
You were told by Congress and the Fed that if the government didn’t raise the debt ceiling, a disaster would ensue. Well, the debt ceiling was raised and the disaster continues. The situation now feels “out of control.”
The debt downgrade was the fundamental driver that pushed gold above the technical channel and onto what I’ve labeled the “super highway” price channel. The Fed seems to have pulled out all the stops, and still business is almost at a standstill. Something is very wrong.
The economy is weakening, unemployment remains over 9%, and the stimulus that did not help before is called for again. The Fed can lower rates to boost bond prices, but not enough to help businesses.
Ben Bernanke told Congress in July that the Fed would intervene to buy US Treasuries if the economy began to stall or if deflation re-emerged as a threat. My Sept-Nov USD $65.00 target for the dollar on the above chart feels solid. Longer term, the fundamentals indicate death or coma for the dollar.
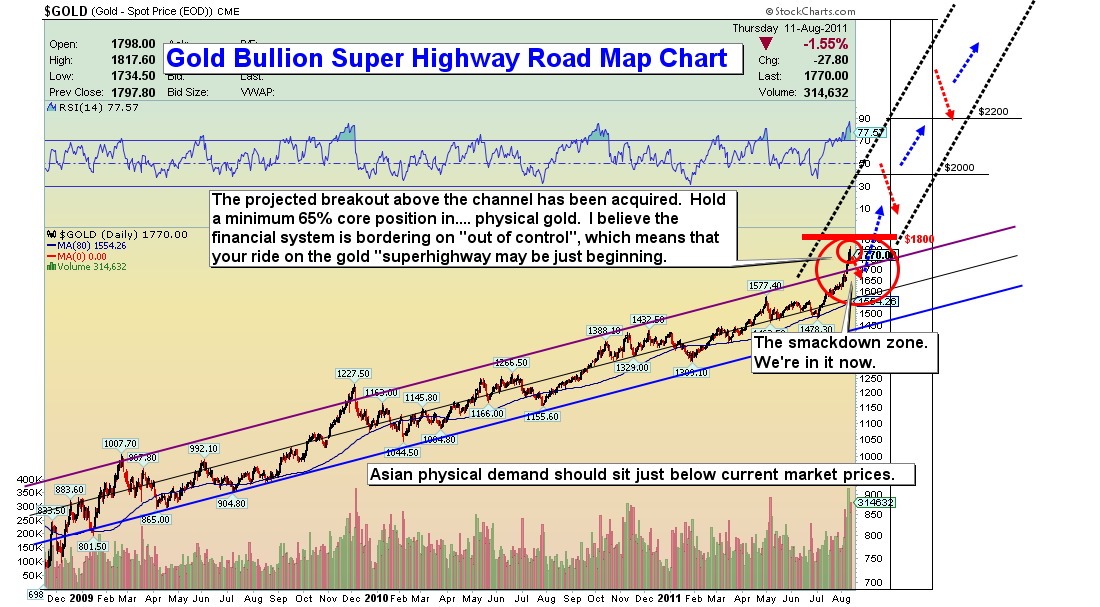
Gold Bullion Super Highway Chart
Gold Analysis
I believe this gold chart is the most important long term chart you can examine. It is a picture of a likely revaluation that could see gold go way beyond even what is indicated on my chart.
Welcome to the battle for gold $1800. While the move onto the “super highway” may have officially started, don’t think this is going to be an easy ride. There will be a lot of money to be made, but there will be unbelievable pain for those who don’t play this situation correctly.
If you own gold, sit tight, particularly in core positions, which should not go below a level of 65%. The rush to liquidity by global central banks means a much higher gold price, but the volatility will likely be brutal.
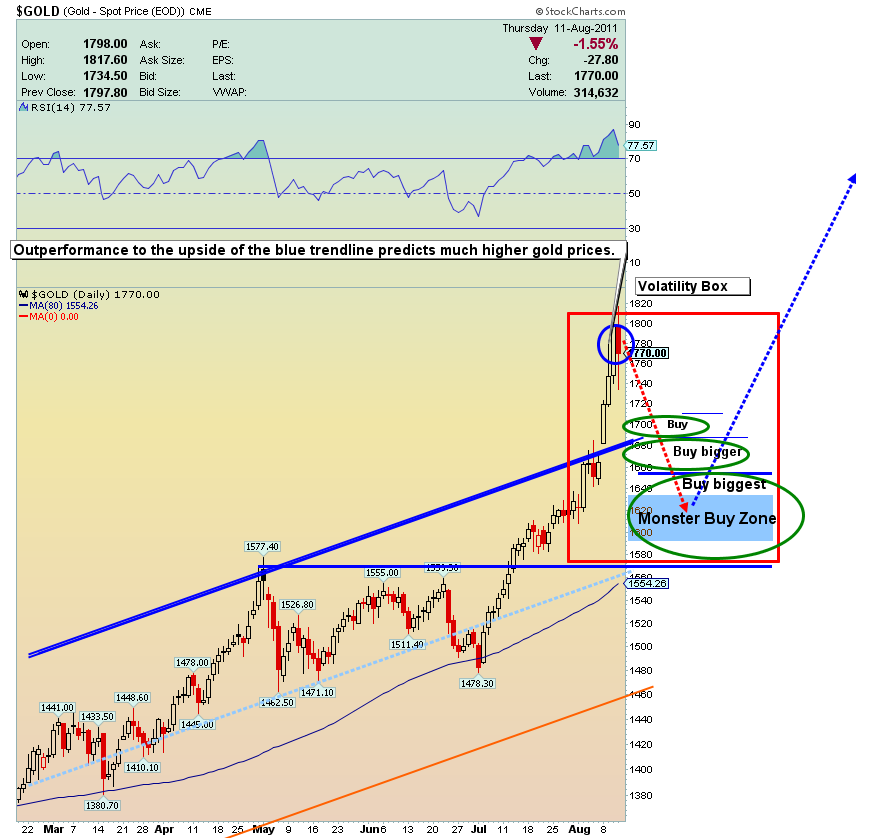
A Closer Look At The Gold Super Highway Chart
Note the buy areas on the above chart. I’m expecting this timeframe (now) to be a corrective area (red box on the chart) that will likely be taken out to the upside after a few weeks of corrective action. Remember that I told you that would likely correct “around Mid August.” We are entering that exact timeframe now.
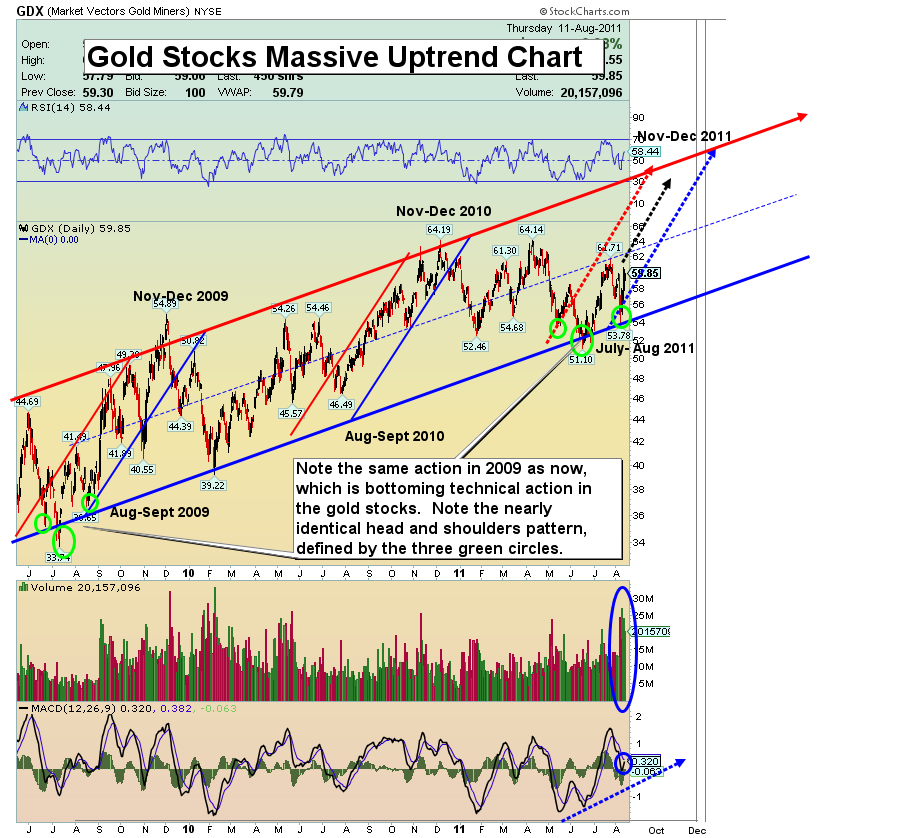
You don’t have to be able to see the stitches on a fastball to know that eventually there will not be enough gold to satisfy demand. With the US debt now officially downgraded, gold stands head and shoulders above every asset on the globe. The steeper up channel is caused by new money flows from investors who were unnerved by the debt downgrade. Shorting gold stocks now is like playing Russian roulette, with the chamber full of bullets.

