


US Dollar QE Repercussion Chart
Dollar Commentary
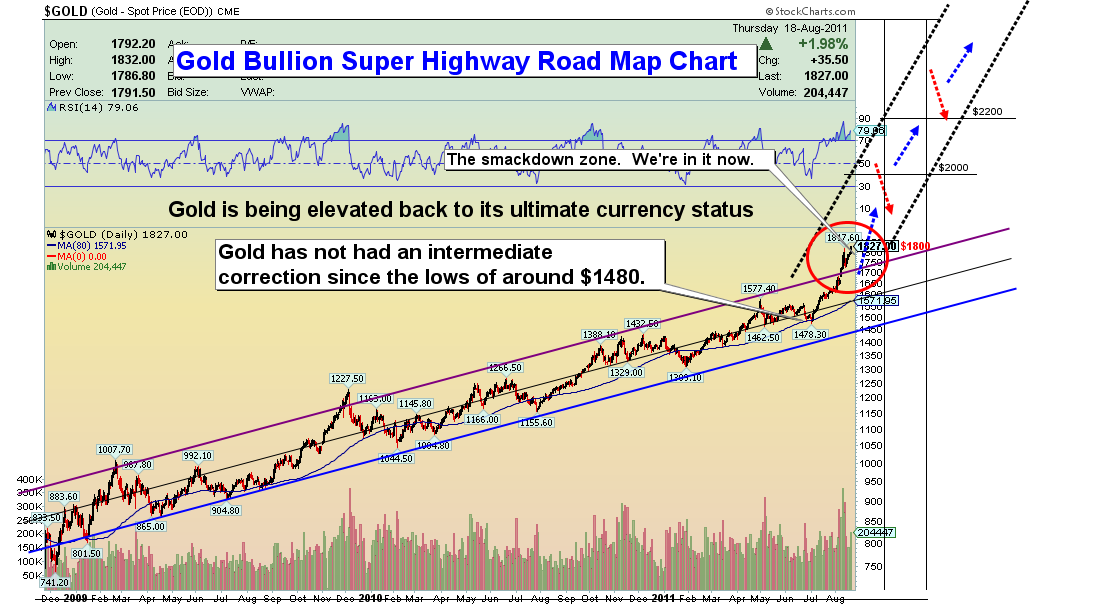
Loss of confidence in the dollar is accelerating and it effectively sits now on what amounts to a trap door. US debt downgraded by S&P was a big story. The bigger story is the performance of the dollar in comparison to gold! Gold is being elevated back to its ultimate currency status. I think it’s fair to almost say that it is gold that has really downgraded the dollar for months, and this downgrade continues with a fury.
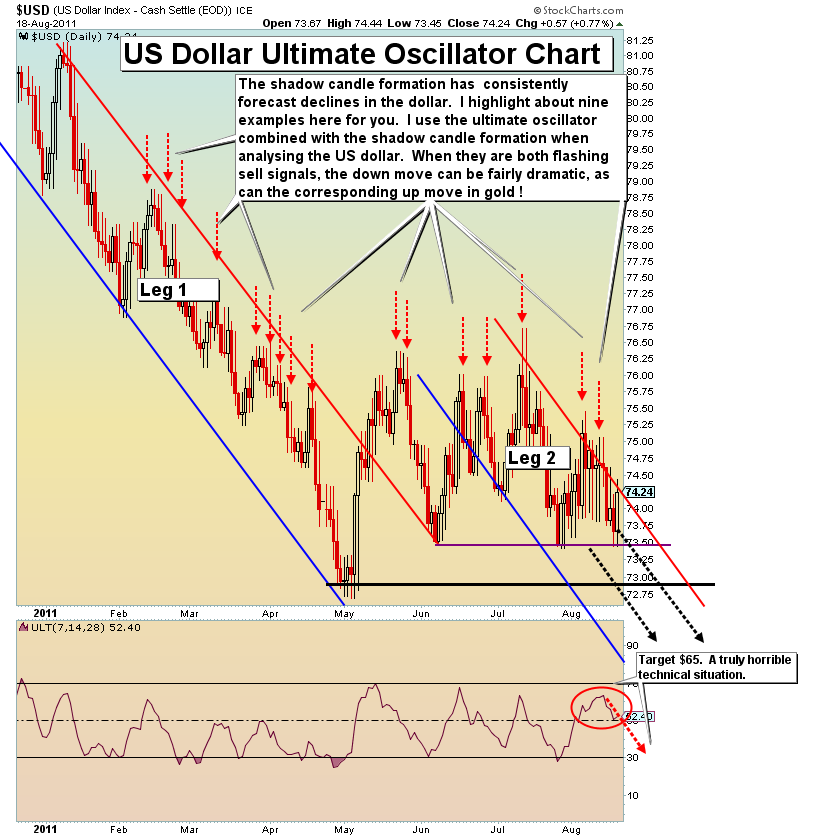
US Dollar Ultimate Oscillator Chart
The USD has had a rough 12 months, losing in excess of 10%. Unfortunately, the policies of the United States Government for the foreseeable future are unchanged. I expect that policy to show itself in the performance of the dollar.
During protracted downtrends, I like to use the ultimate oscillator on my price charts. When a rollover in the oscillator occurs in conjunction with a shadow candle formation, odds favor a decline. This chart could alternately be labeled the “Trap Door Chart”. Technically, the picture is absolutely horrific.
It’s hard to believe the current placement of the ultimate oscillator now, considering how far the dollar is already down, yet it’s predicting still lower prices! My 2011 target on the currency remains $65. The projected time frame for the target price is November 2011, although a delay into February is possible.
Gold Analysis
The great awakening is taking place, for gold. We are only at the very earliest moments of the public beginning to notice gold. It’s almost imperceptible now, despite gold reaching mid $1800s! As the perception grows, it may create a new phase of the gold bull market. It could deliver great new highs in all sectors of the precious metals. The trigger was the debt ceiling fiasco that made headlines around the world. I believe the deal was another wrong step, down a dead-end road, by an out of control government.
The higher gold goes, the more apparent the failing worldwide fiat currency system becomes. Central banks, which have been net sellers of gold, are now net buyers. The Wall Street Journal reported yesterday that central bank buying quadrupled in the latest quarter! This is an under-reported phenomenon that shows tremendous confidence of central bankers in gold.
Technically, gold has completed a price overshoot. What I mean by this statement is that price has risen enough above the upper supply trend line to label the situation as signifying price is out of the former rising channel and entering a new one.
This action has been a feature of the gold bull market since inception, and it is now ushering in the gold “super highway”. The big question is, how do handle yourself in the gold market now?
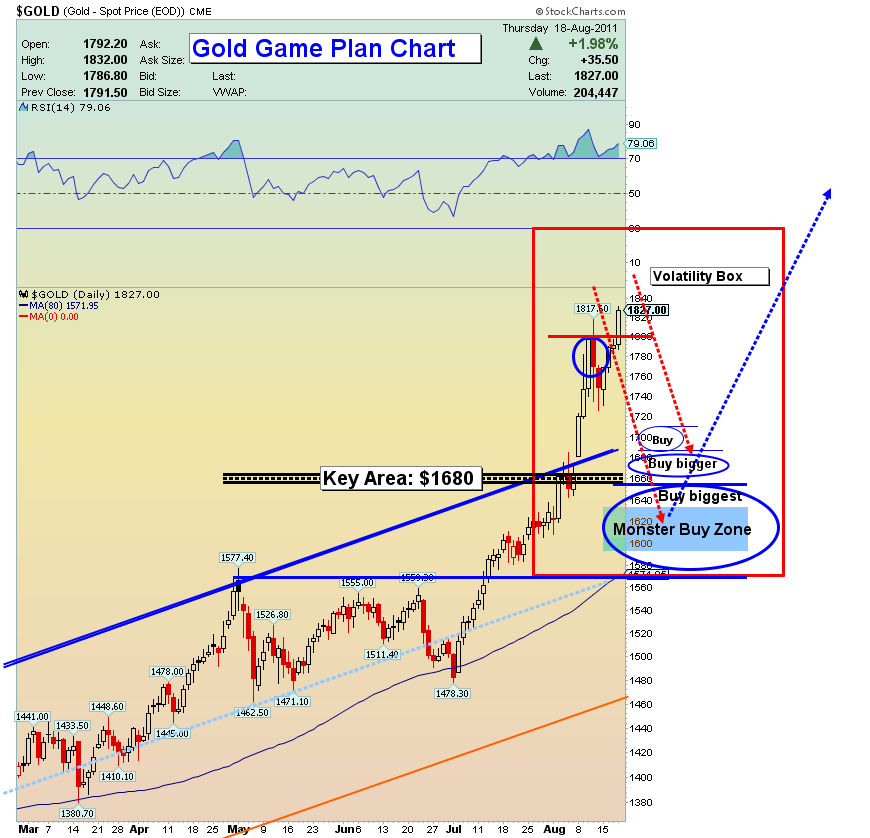
Well, here’s what I expect into the next several weeks, and I hope I’m not raining on any parades. The fact is that I suspect $1680 could be tested. It is really the price area that ushered in this accelerated phase of price appreciation. If you have physical gold, just sit tight. For those who don’t, I would strongly recommend buying down into the $1680 area, incrementally. We may touch that price before surging higher, but we may not, so buy into the target, not just at it.
Buying gold in the future at higher prices than where we are now is likely to be very painful for those who try. Buy weakness now, because the heat in the volatility kitchen is going to get much hotter. This gold market is not a normal market. You must be prepared for gold to get technically overbought and stay overbought, for months or longer, and exhibit unbelievable swings in price.
I am projecting that the volatility in gold will dwarf anything you’ve seen in the Dow in the last ten years.

