


Gold and Precious Metals
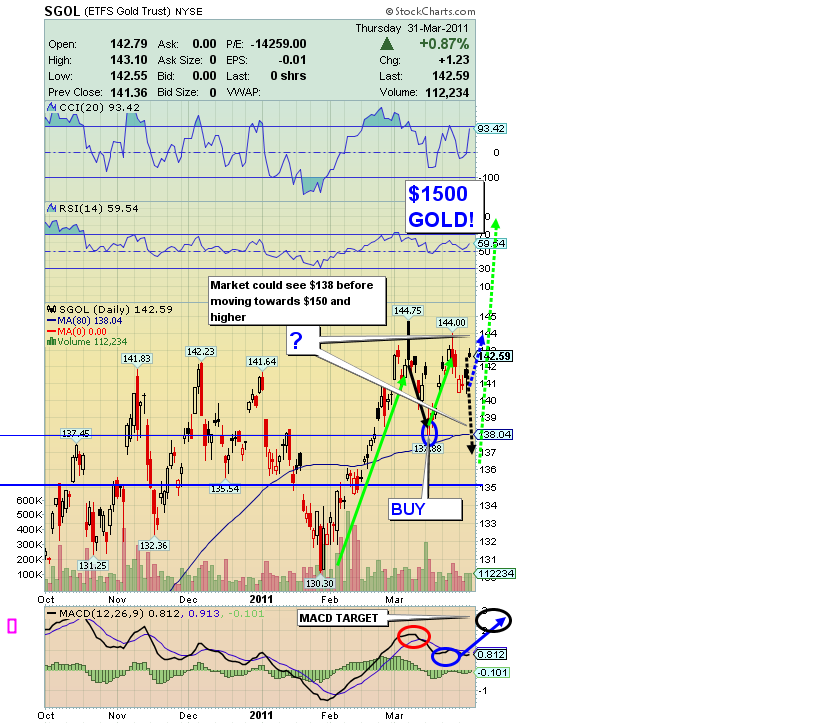
SGOL (Bullion Proxy) 6 Mth Chart
SGOL 6 Month Chart Analysis
- Now is not the time to play games with gold or gold stocks. Those with no core holdings could be wiped out. Metals are the only insurance for the coming economic nightmare, and they are going much higher.
- Look closely at trading signals on my charts today. Use my buy signals to increase your core positions and lower cost, always enlarging your overall position. Strive for real economic security with your gold. If your financial advisor is telling you to sell all your core gold holdings, I hope you are not listening! What is coming down the pipeline, economically, is disaster.
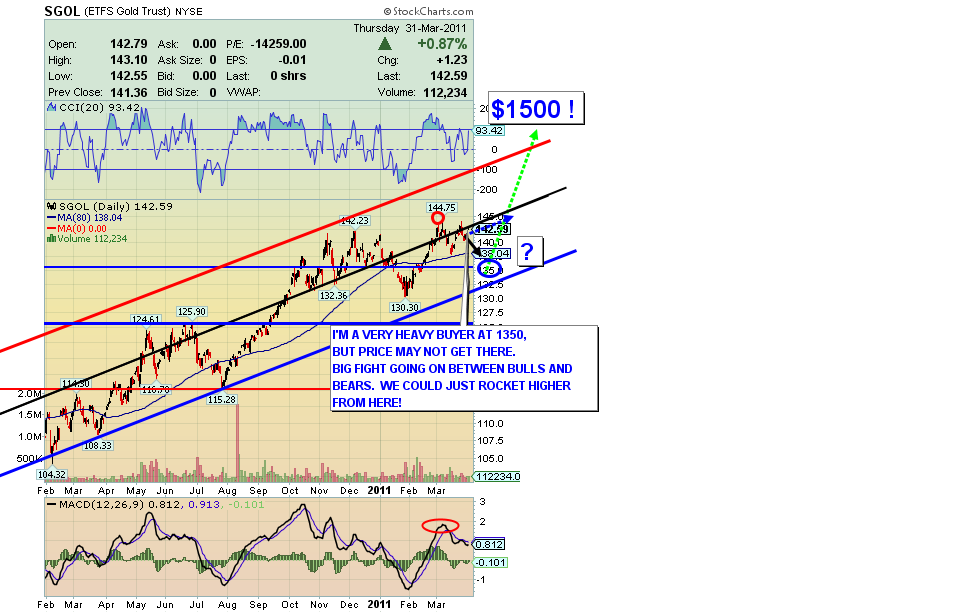
- This huge precious metal bull market is now greeted with heavy scepticism. Even the gold community seems to be a bit unsure. There are too many doubters, and that spells higher prices!
- The debt crisis is the main fuel cell for the rising price of gold. Debt levels are still rising, to the point that the system may be nearing or even past the point of no return.
- “Hyperinflation is assured.” ~ Jim Sinclair, March 31, 2011.
- As long as debt is rising, gold and silver are going to go higher. It is important to have a large core position (I recommend 65%) in the metals sector.
- Black Swan events keep coming. The Middle East, Japan, and food-related events may be in the pipeline. We are at the very cusp of an enormous blast higher in the metals, and it will catch most of the investment world totally off guard.
- When considering all of the assets one can hold, such as commodities or stocks or cash or gold, which one is the best? Of all assets, physical gold stands tallest. The physical market for gold is in the strongest hands, and they will accumulate all weakness in the market because they sense an economic nightmare is near at hand.
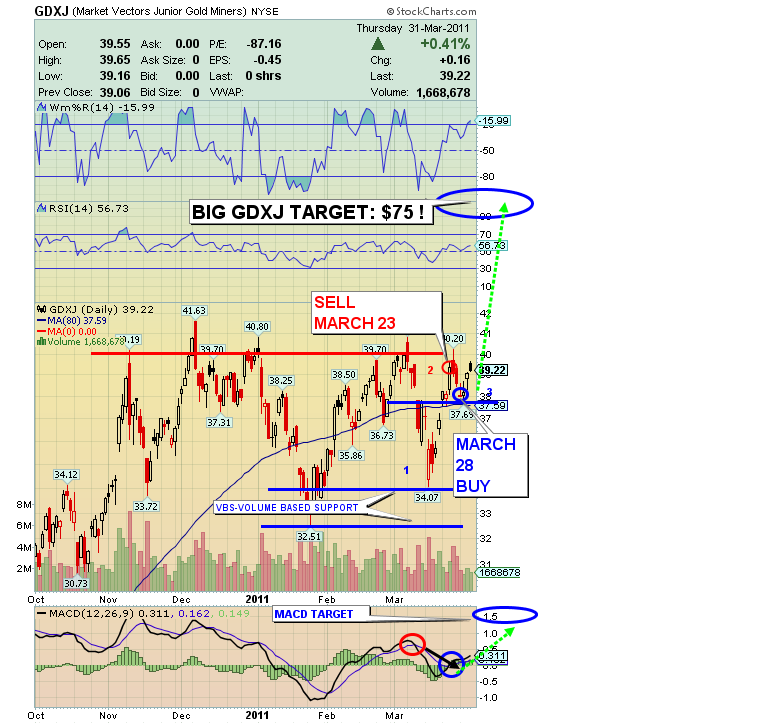
GDXJ Chart Analysis:
- I just issued a fresh buy signal on March 28th for GDXJ. I look for weak volume pullbacks to enter fresh buys, which is what happened Monday.
- With physical gold in the strongest hands, my SFS Gold Stocks Ratio continues to project a huge target of $75.00 for GDXJ! If the target is acquired, many individual juniors would rise by hundreds of percent!
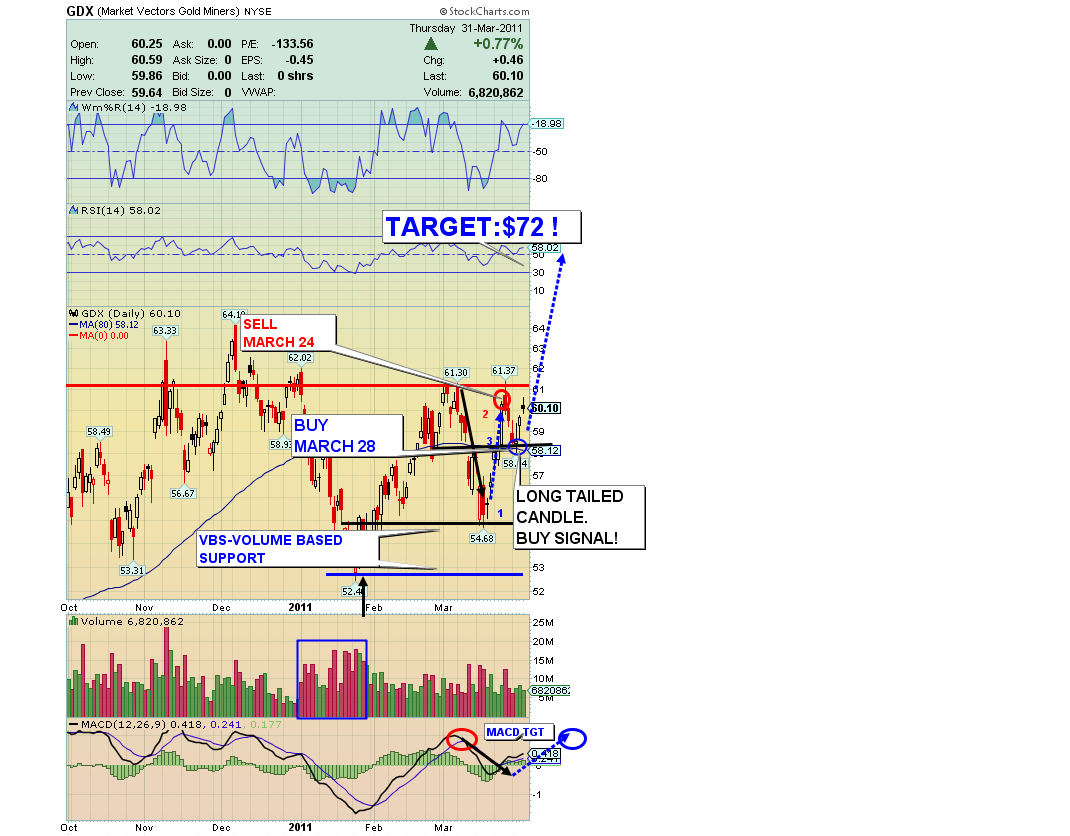
GDX Chart Analysis:
- I just issued a fresh buy signal on GDX Mar. 28th. Look at the long tail on the identified candle from Wednesday’s trade. This candle is suggesting more upside for this move. When you get this type of candle configuration, particularly in gold stocks, it can spell higher prices for quite a few more trading sessions. It is a sector-wide phenomenon and very powerful.
- As bullish as I am, this market could roll over after the current move higher is completed, opening the rocket door for final boarding. In a correction, the GDX $55.00 range is the best opportunity for heavy buys, if we get there. VBS (volume-based support) is sitting in that area for GDX.
- My volume analysis of the current trading sessions indicates only one more buying opportunity, before take-off!
- One year target: My SFS Gold Stock Ratio projects a $72 one year price target for GDX. Imagine what that means for some of your intermediate and senior gold stocks!

